Sales and Marketing – Making Sense of Vertical Markets
The phrase “vertical markets” has a different meaning depending on what segment of the trade show and convention industry you’re talking about. Trade show organizers regard a vertical market from a purely commercial point of view. For them, vertical shows promote a single industry category to a specific clientele. By contrast, a horizontal show has many product categories with broad market appeal. For example, Cebit, the huge technology event staged annually in Hannover, Germany, is a horizontal event. CeBit showcases a wide range of innovations and products from many vendors. The attendee base is from many industries. Compare Cebit with another IT event, the Healthcare Info & Mgmt Systems Society Conference and Exhibition held in Chicago this year. This vertical event is held specifically for the medical healthcare sector and the difference is evident.
For convention center and CVB sales and marketing teams, the meaning of vertical markets is very different. Here the meaning is broad and can refer to any event in a particular industrial sector. The phrase “verticals” is often used in marketing plans and intra-industry conferences among convention center and CVB managers. Quite often you will see staffing responsibilities defined with “vertical” sales and marketing assignments; medical, financial, manufacturing, agricultural, religious, etc.
How are vertical markets selected?
- The Case of Professional Associations – For cities pursuing professional association events, the destination appeal, the hotel and meeting room package and the overall cost to association members governs location decisions. Cities and convention centers should know their destination attributes, have a good sense of price point tolerances and overall be able to choose verticals which fit. Large leading convention cities which attract a wide range of association convention and conference business will naturally choose the most reliable and profitable verticals to target. For second and third tier cities the targeting of certain verticals has to be more measured and reflective.
- The Case of Trade Associations and Privately Owned Trade Shows – For these events, location choice is governed by the marketplace where buyers and sellers will reliably gather. Choosing which verticals to pursue is based on straight logical business reasons; the industry represents a leading employment base in the region, there is emerging industry growth giving the region leadership status and enumerated by the number of start-up companies, new patents, amounts of venture capital investment, etc. It could also be that the event’s industrial sector fits your city’s traditional brand – San Jose is “Silicon Valley”, Nashville is “Music City “ , Chicago is “Tool Maker, City of Big Shoulders”. These are all good reasons to dedicate sales and marketing resources to certain vertical markets.
We considered all this and believe the selection process for verticals falls short. What is missing is quantitative analysis of actual market behavior over time. Our belief is that the effective use of statistics and thus chances of success (probabilities) complements and improves marketing judgment. Well informed professional judgment can contribute insightful, nuanced interpretations of data and add market intelligence that cannot be enumerated. Over time quantifying things will become a basis for reliable business forecasting and provide a true rationale for pursuing verticals. It also creates a clear vision of market impediments and opportunities.
We took an in-depth look at two verticals; medical/health science and religion. Both are popular verticals; medical/health science due to its growth, reliability and spending behavior and religion because their events normally occur in summer. Our approach was to obtain as much information as possible by reviewing event directories, news articles about the same subject markets and visiting individual event websites. Our method was to select a sample of events (we chose large national events) and obtain a history of event locations. Our hope was to obtain 10 years for each event, our average was 6 years. We fit the events into eight (8) regions which were selected based on geography as well as economic and cultural similarities:
- Hawaii – On Oahu – Honolulu, and other islands – Maui, Kauai and Hawaii
- Pacific Northwest – Alaska, In Canada – Vancouver, Washington, Oregon and Idaho
- California
- Southwest – Arizona, New Mexico, Nevada and Texas
- Rocky Mountains – Utah, Colorado, Wyoming and Montana
- Midwest/Plains – North and South Dakota, Iowa, Missouri, Oklahoma, Nebraska, Kansas, Minnesota, Wisconsin, Michigan, Illinois, Indiana, Ohio
- Northeast – In Canada – Toronto and Montreal, Maine, New Hampshire, Vermont, New York, Massachusetts, Rhode Island, Connecticut, New Jersey, Pennsylvania, Delaware, Maryland, District of Columbia
- Southeast – West Virginia, Virginia, Kentucky, Arkansas, Louisiana, Mississippi, Alabama, Tennessee, North and South Carolina, Georgia, Florida, Puerto Rico
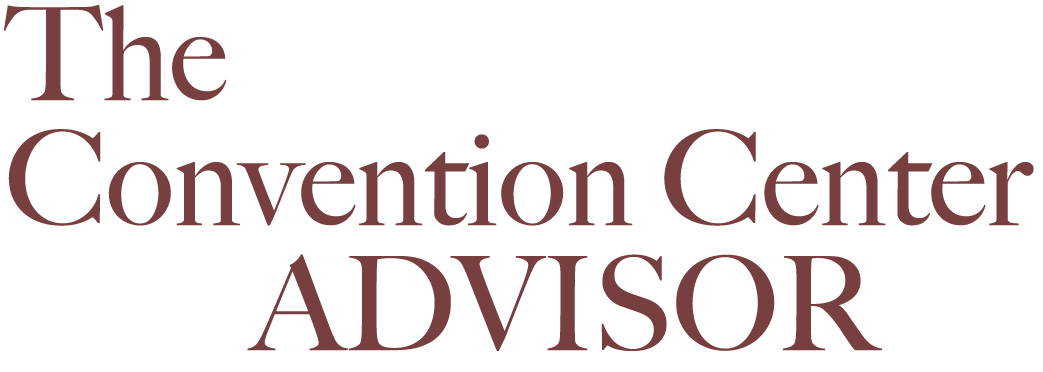
Our main objective was to record shows with fixed locations and examine and record shows that changed locations each year. For rotating events we picked out predictable patterns as they rotated regions and cities within regions. We also determined probabilities of success for individual cities. The analysis also permitted us to draw conclusions, to explore the fundamental reasons for location decisions and to offer suggestions for convention center and CVB sales teams. We feel we achieved a true and unique understanding of these event markets. The tables below show the results for leading cities:
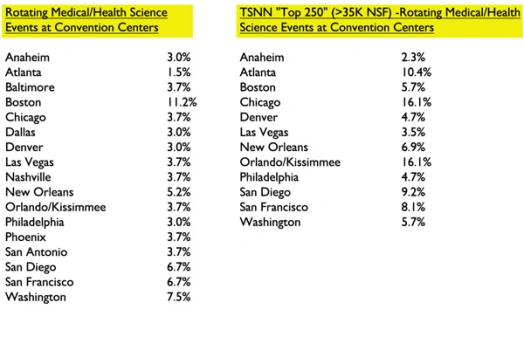
The statistics above show a more open ability to for cities to compete for these events if a larger sample of rotating national events is used. When only surveying large and presumably more important medical/health science events the findings show the events more likely to choose higher rated cities. Interestingly, Chicago’s percentage climbs to 19.2% if all TSNN Top 250 shows are included (RSNA, ASCO and Chicago Dental among them).
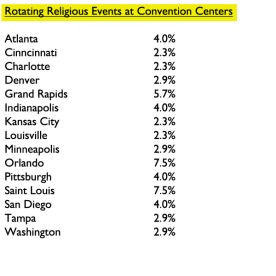
For religious events there is clearly a preference for cities in the Midwest and Southeast. Also notable is that second and third tier cities have relatively high probabilities of booking success.
Convention center and CVB sales teams need to take time to create a statistical description of each vertical shaped and informed by professional judgment as a likely market. Obtain as much history as possible, look for predicable patterns and calculate chances of success. Find out why events choose certain regions, cities and venues over others. Compare one vertical to others and determine which is worth pursuing based on probabilities. The purpose for defining these verticals and obtaining predictable patterns and probabilities is to organize your marketing/sales program to concentrate on the most likely prospects.
Click the link below and learn more about the medical/health and religious event markets by purchasing and downloading our white papers – “In the Pursuit of National Medical/Health Science Events – A Primer Focused on Convention Centers” and “Booking National Religious Events – A Primer for Convention Centers on How Event Location Decisions Are Made” http://www.conventioncenternow.com/white-papers
Keeping Track of Business – All About Occupancy
For convention centers there is certain elegance in using occupancy as a key performance indicator (KPI). One indicator can reveal all – you’re busy, you’re prosperous and perhaps profitable, your operation provides a steady employment base, and your business draws a lot of out-of town visitors to city hotels, restaurants and entertainment venues – or not. High occupancy draws praise, increases revenue, supports further investment, and permits a level of selectivity when booking events. Low occupancy draws scrutiny, often unfavorable, which questions the wisdom of the investment in the first place, and the reaction from convention center management and advocates is generally uneasy and strained. However, occupancy as a performance indicator is unavoidable. As operators you should focus on it and understand how to react and use it. Occupancy is not complicated. Using the method that hotels use as a model is a simple and legitimate way to follow. The performance indicators used by hotels is based on the “Uniform System of Accounts for the Lodging Industry”. These standards are tried and true and accepted by the hotel industry:
For hotels, occupancy is the percentage of available rooms that were sold during a specific time period.
- Supply (Rooms Available) – the number of rooms in a hotel multiplied by the days in the month
- Demand (Rooms Sold) – number of rooms sold by a hotel, does not include comp rooms or “no-shows”
Occupancy is calculated by dividing the demand (number of rooms sold) by the supply (number of rooms available). Therefore – Occupancy = Demand / Supply. Reporting periods for hotels are generally by month and quarter both, with a cumulative average calculated annually. Note that occupancy is not applied to other parts of the hotel such as meeting rooms. The core business of the hotel is to sell sleeping rooms, so the occupancy measure relates to only core performance.
Measuring occupancy should be very similar for convention centers. In this instance because meeting rooms are sometimes viewed differently than exhibit halls, all rentable space (meeting rooms, ballrooms and exhibit halls) should be expressed in square feet.
- Supply (Space Available) – The amount of square feet available (sum of meeting room, ballroom and exhibit hall square footage) over a given time period
- Demand (Space Rented/Licensed) – The amount of square feet rented/licensed (sum of meeting room, ballroom and exhibit hall square footage) over the same time period
Occupancy is calculated by dividing the demand (amount of square footage rented/licensed) by the supply (amount of square footage available). Therefore – Occupancy = Demand / Supply. As an example, say your convention center rented 150,000 sq. ft. for 17 days in September. Your center has 300,000 sq. ft. available to rent each day, then:
Occupancy (September) = (150,000 sq. ft. x 17 days)/ (300,000 sq. ft. x 30 days)
Occupancy = 2,550,000/9,000,000 = 28.4%
Curiously, in my time as a consultant I have run across more than one convention center using a different method which is absurd and just plain wrong. In those cases any occupancy, no matter how small, is regarded as 100% for the time period. Now that’s more than a fisherman’s lie, a great deal more.
Occupancy Nuances
Occupancy is always questioned when serious capital investments, like center expansion, are considered. If board members don’t question it, bankers surely will. There are always distinctions, implications, and complexities when measuring something so important. Know what they are and be prepared to explain things rationally. It’s best to have other performance indicators as support.
- Event Move – In and Move – Out Days – Regard these days as occupied days. Here is where you could say that one center’s occupancy figure for an event does not equal another’s. If your occupancy level is traditionally low, you will often permit many more move-in and out days than a center with high occupancy. You may even comp or discount the rent for those extra days. Contrast this to a very busy center where aggressive date/time management means attaining a few more events. Hence, the number of move – in and move – out days is actively negotiated. The difference between the two convention centers may be inconsequential but it is a worthwhile distinction to understand.
- What About a History of Low Nets? Doesn’t that De-value the Value of Using Occupancy as a Key Performance Indicator? – Yes it could. In my time at the Javits Center we always measured show net to gross square footage (expressed as per cent) for exhibit halls. Our purpose was to monitor net square footage performance. A low net to gross ratio was often cause for a discussion with show managers whose event may be declining. The Javits Center had many recurring events and still does. If we saw an event consistently fall below a certain net/gross percentage, after a time we’d move the event to less desirable space in favor of a show that was growing or a new show. Our advice is to measure net/gross % in parallel with occupancy.
- What About the Quality of the Events? Where Does Occupancy Fit In? – Occupancy is agnostic to the quality of events. Agreed, there are some low quality events, like electronic wholesalers or flea market type consumer events. Let the quality issues come out in the other performance indicators such as service revenue per net square foot or the number of hotel room nights generated.
- What About Events that Are Licensed Outside of Rentable Space? – The example set by the hotel industry applies. They only measure sleeping rooms in their equation. Sleeping room sales is their core business and a simple and pure occupancy figure avoids distortion and equivocating. Rental of meeting rooms or ballrooms is not in a hotel’s occupancy rate. But consider that most other hotel income, meeting room rental, F&B, parking etc., derive from sleeping room sales. Some convention centers conduct business outside normal rentable space (meeting room, ballrooms and exhibit halls). The LA Convention Center and the Javits Center enjoy revenues from film and photo shoots. The price basis for this business is normally a location fee, unless they are using meeting rooms or an exhibit hall. That’s not the usual way film and photo shoots operate however. They favor public spaces and tend to be free ranging, making on-site changes and often using a variety of corridors, outside space, even the roof. It’s tempting to include all the free ranging space used and include it in occupancy calculations. Our advice is stay pure, keep this square footage used out of occupancy calculations unless they operate in a fixed rentable space.
Parsing Occupancy
Now that you understand occupancy, use it as a statistical foundation for other key performance indicators:
- Compare occupancy by exhibit hall by month – Use it as a basis for setting rental prices. Demand pricing is used in many other business sectors, most commonly airline travel and hotels. You can simulate past years occupancy to see how revenues can change with a demand pricing model. The objective of course is to increase rental revenue and create price incentives for events to consider off months and less popular halls. To our knowledge no convention centers use demand pricing as a consistent formal pricing method.
- Calculate monthly and annual revenue and expense per Occupied Day – Use this as a basis for forecasting based on predicted occupancy.
- Calculate monthly and annual energy use and cost per Occupied Day – Use this as a basis for forecasting energy costs, one of your largest line expenses. Graph same and you may be surprised what you find. Our good guess is the result will be non – linear.
Seventy Percent (70%) – Why is it Maximum Practical Occupancy?
More than 20 years ago the firm PWC proclaimed 70% to be the maximum practical occupancy for convention centers. Their logic was that convention and trade shows have definite dates and days of the week in mind and typically don’t compromise. Naturally there are gaps of several days or more between these events. Add holiday times of year such as Christmas when any trade show or convention is rare. Now the event day possibilities lessen, making 70% ring true. Having experienced over 70% occupancy, there are other factors to support PWC’s theory:
- Building and plant maintenance becomes quite difficult. Deferred maintenance lists grow rapidly. Odds increase for a utility infrastructure failure – power outages, air conditioning failures
- Labor and staff end up working long hours. Sometimes inexperienced part time workers have to be hired, leading to service complaints. Vacations and time off become difficult to schedule
- General Decorating contractors, already working with thin profit margins, see profits shrink as they may have to fly in extra management and supervision from other cities. Labor over-time prices are unavoidable, except in cities with “1st eight straight” work rules.
Facility Management – Energy Management – Choosing a Replacement Lighting for High Bay Fixtures in Exhibit Halls – LED vs Induction Lighting
For high bay lighting applications in exhibit halls, most of you have already made the transition from mercury vapor to metal halide. Now many of you are no doubt thinking about the next transition. Lighting technology is improving at a very rapid pace and each technology transition provides material improvements in lighting efficiency (lumens/watt), lumen depreciation, lamp life, energy costs and maintenance costs. Two lighting technologies have demonstrated clear advantages over metal halide; induction lighting (IL) and light emitting diode lighting (LED).
IL lamps are a specialized type of fluorescent lamps that do not have direct electrical pin contacts but rather use an electromagnetic coil which provides a more gentle start making the lamp life much longer. Their commercial application is growing steadily and they are frequently used for street, parking lot and site lighting. IL’s long bulb life (100,000 hours) make them an excellent candidate for high bay lighting applications.
Until this past year operators of commercial buildings with ceiling height more than 20 feet had limited choices for the next generation of energy efficient lighting. LED technology could not measure up to customer expectations for providing uniform light at floor level for high bay fixtures. However, rapid improvements in luminaire design (especially in regard to brightness and glare) and lighting efficiency make LED a competitive choice. Also, the differentiator of pricing between the two technologies is slowly disappearing. Falling prices and rising lighting efficiency is beginning to generate savings that offer payback periods of 2-3 years for LED comparable to IL.
There are many quick and simple comparison charts and tables available on the internet listing the pros and cons of LED and IL. It’s important to understand that these references often promote a point of view where one technology is favored over the other. The negative references tend to focus on the case studies of low quality products which often populate markets when new technologies are rolled out- this is the case with LED.
Operating Factors – Comparison
The comparisons below between IL and LED represent a composite of actual installation experience as a facility consultant for St. Johns University in New York City, an extensive literature review and, interviews with lighting engineers and the Association for Energy Engineers:
- Lighting Efficacy (lumens per watt – l/w)
- LED – 85 -95 l/w; New generation LED bulbs are reported to have efficacy values of 110- 120l/w. Philips Lighting has reported development new LED bulbs with efficacy values exceeding 200 l/w.
- IL – 70 – 85 l/w
- Color Rendition Index (CRI) – Convention centers should consider themselves as a retail environment. CRI values less than 80 are not acceptable. Ask distributors about bulbs with CRI values greater than 80.
- LED – 80
- IL – 80
- Correlated Color Temperature (CCT –in degrees Kelvin) – The higher the CCT the more clean or bluish the light quality. A lower CCT (<3000) will produce a warmer light quality.
- LED – 2,700K – 6,500 K
- IL – 2,500K – 6,500K
- Lamp/Bulb Life (in operating hours)
- LED – 50,000 to 55,000 hours
- IL – 100,000 hours
- Lamp Lumen Depreciation (LLD – % lumen loss over time)
- LED – LEDs will see a gradual decrease very similar to IL in lumens to 50,000 hours then LLD will drop steeply. This performance is dependent on the ability of the fixture to dissipate heat. LLD will be greatly accelerated if this cannot be controlled.
- IL – IL bulbs lumens decline about 10% in the first 10,000 hours then remain fairly constant until about 70,000 hours when LLD begins to drop steeply
- Light Dispersion Characteristics
- LED – LED has more flexibility with light-distribution patterns. With LEDs and their secondary optics, you have the ability to get the light where you need it.
- IL – Induction luminaires must be used with a reflector in order to make use of the total light output.
- Glare Characteristics
- LED – Can be a serious problem. Poor fixture design and elevation placement can cause very distracting glare with LEDs. LEDs light comes from tiny sources that create very high brightness from a very small area — very high nits or candelas. The key to success is optics. This is no small matter to convention center management and you have to get it right.
- IL – Not a problem with properly designed luminaires
- Reliability (Failure Rates)
- LED – There are reports of unsatisfactory reliability from poorly manufactured fixtures and bulbs. Convention center managers are wise to rely on a high quality LED manufacturers (GE, Philips, Lumileds, Cree, Nichia, OSRAM) to ensure reliability
- IL – A more mature technology with a good reliability record
- Ambient Temperature Sensitivity
- LED – Very sensitive to sustained high temperatures (>25 degrees C or 77 degrees F). Many high-bay LED fixtures feature a horizontal top surface that’s susceptible to dirt accumulation. This reduces the fixture’s ability to keep the lamps cool. It will also reduce lamp life and increase LLD. Fixtures with vertical fins are less prone to clogging from dirt. For exhibit halls in most of the US, there is a definite stratification of temperatures in exhibit halls especially during event move in and move out. Temperatures at elevations above 25’ can easily exceed 90 degrees F. If LED is elected, be sure to compare a fixture’s rated temperature to the expected ambient conditions. Otherwise, you may have to consider de-stratification fans (paddle fans won’t do). If choosing LED obtain the lamp/ with the best temperature performance.
- IL – Much better performance at high ambient temperatures (50 – 100 degrees C or 122 to>200 degrees F) with little to no effect on lumen output or lamp life
- Fixture Appearance
- LED – Some of the heat sink designs make the fixture look very unconventional. Also a flat topped fixture is likely to accumulate dirt.
- IL – Very conventional looking fixtures.
- Warranties
- LED – Presently up to 5 years
- IL – 5 to 10 years
- Disposal of Hazardous Waste
- LED – There may some exotic elements in the circuitry. Ask the manufacturers and pay attention to environmental protection regulations
- IL – IL contains a small amount of mercury. The disposal of mercury is regulated and requires special procedures
Recommendation
We are clearly in favor of LEDs over IL. The pace of improvements in all operating factors is very rapid and we believe the IL advantages, such as lamp life, will slowly disappear. We advise that if elected, you choose on the basis of quality considering all factors, not simply energy savings. This means relying on brands that have a history and indeed legacy of manufacturing quality lighting products. Other factors to consider in this decision are listed below:
- Certainly no convention center manager wants to be faced with a highly visible failure of LED fixtures. For LEDs, there is still uncertainty regarding consistent quality as industry wide and governmental standardization and regulation continue to evolve.
The DOE Energy Star program is one where you can find standards which should give some safety and direction to a decision to installed high bay fixtures:
Look for the ENERGY STAR label. ENERGY STAR means high quality and performance, particularly in the following areas:
- Color Quality
- 6 different requirements for color to ensure quality up front and over time
- Light Output
- Light output minimums to ensure you get enough light
- Light distribution requirements to ensure the light goes where you need it
- Guidelines for equivalency claims to take the guess-work out of replacement
- Peace of mind
- Verified compliance with more than 20 separate industry standards and procedures
- Long term testing to back up lifetime claims
- Testing to stress the products in operating environments similar to how you will use the product in your home
- 3 year minimum warranty requirement
All ENERGY STAR products are subject to random testing each year to ensure they meet the ENERGY STAR requirements.
- Consider the fact that most of the retail world is converting to LED. The exhibit floor during a trade show is very much like the retail environment.
- Philips Lighting has entirely abandoned Induction lighting and is actively promoting LEDs over all other lighting technologies (at which they are the global leaders).
- Convention center finance managers have grown used to very favorable ROIs and paybacks for lighting improvement projects, usually less than 3 years. In this instance, where the higher cost may push the payback higher, we recommend a life cycle costing evaluation. If capital is a problem, there are many rebate programs available related to demand reduction as well as straight energy conservation through your electric utility and/or state government.
Before you launch a lighting replacement program with LED in mind, we recommend that you engage a lighting engineering group, one that has many retail clients. In lieu of hiring a lighting engineer, choose a lighting distributor that has no strong business ties to either IL or LED manufacturers. In fact a record of installations using both technologies should be a prerequisite. Narrow your choices but first do a test in one or more areas of your exhibit halls, take measurements and seek reaction from some of your clients.

Very interesting, Myles, well-researched. I admit, as an organizer, I didn’t read the last article. However, the first one really interested me because I have felt for years that if convention centers clearly researched and understood their own business community, they could market to the “right” organizations and event managers to capture more business. An important factor here when understanding the business community, is understanding “Buyers” and “Sellers”. Show organizers want to be where the Buyers reside or a destination Buyers can easily access. Suppliers will come if the market is there. So knowing the titles/profile of the business community members — BUYERS — is important. I know it’s work, but it can lead to business.
I could be wrong, but I think the religious market is purely price-driven. Seeking that market requires a convention center in a DESTINATION with low attendee costs: low hotel costs (Perhaps from multiple occupancy?) and low travel costs. The cost of the rental of the facility is a factor, of course, but the organizer doesn’t care if he/she saves $20,000 on rental to find that attendees don’t come because of the high travel costs. Taking into account the attendee base…who can drive within, say, 6 hours?….. and who must fly….all of that comes into play. I know it’s a big market. A friend of mine who has had a very successful business in this field said to me “Oh, yes, Jill, believe me, there’s a lot of money in Jesus” when I expressed my surprise at the amount of business they did with religious organizations.
There’s a great deal more here, with the vertical sectors, including the distinct difference of “show organizers in the for-profit field of medical/health” vs. “associations in that same sector”. There are still some associations that are bound to rules that require them to either rotate geographically or allow the board to select a destination, which sometimes creates the Robert C Byrd affect. (Senator Byrd made sure his home state of West Virginia had the best federally funded highways in the nation: have you ever driven there? it’s amazing)!
Well done, thank you, Myles, I will look forward to future issues.
LikeLike
Jill – Thank you for your thoughtful comments. I’ve been consulting for about 6 years now and I too am surprised how cities and venues will spend all their resources on events they have little or no probability of booking rather than concentrating on their natural market. They can discover their natural market by doing the research and calculating the probabilities as we did. We will probably look at a few more like educational shows, logistic/shipping shows and advanced manufacturing.
Very nice to hear from you again,
Best regards – Myles
LikeLike