
Category: Sales & Marketing
In the US “Convention Centers Are Not Designed to Make a Profit” – A Contrarian View
Profit is a fungible term for convention centers. Sometimes it is expressed properly as you may see it in a public corporation’s annual report. Sometimes it is expressed where revenues include unearned income (such as a government contribution, normally a hotel tax). To avoid confusion this article uses EBITDA (acknowledging that convention centers pay no T – tax). EBITDA is described as a way to evaluate a company’s performance without having to factor in financing and accounting decisions or tax environments. Non- cash expenses of depreciation and amortization are left out. Also, unearned revenue like hotel tax subsidies and interest earned on surplus subsidies and/or expensed for debt service are left out. EBITDA as an earnings measure is particularly useful for organizations like convention centers that have large amounts of fixed assets which are normally subject to heavy depreciation charges. What you are left with is a performance statistic showing whether earned revenues can cover and exceed operating expenses and if not, what amount and percentage (in total revenues) of subsidy is necessary.
How Do Most US Convention Centers View Success
The primary measure of success is to attribute convention and tradeshow annual attendance to a healthy hospitality industry where hotel occupancy is high, and out of town dollars spent at hotels, restaurants, entertainment, shopping venues, rental car outlets, etc., all flow on a regular basis. These facts are reported as “economic impact” – a result of event attendee and event organizer spending. Attendee spending refers to additional expenditure within a city from event‐related visitors such as exhibitors and attendees. For events, attendee spending forms the major component of economic impact. Collectively, attendee and organizer spending in the host city are directly attributable to event production and is termed direct economic impact. All cities however, report indirect and induced spending and add this estimate to direct economic impact. Indirect impact or effects are the changes in sales, income or jobs in sectors within the region that supply goods and services to the hospitality sector. For example, increased sales in transportation to and from airports or linen service companies serving hotels and restaurants resulting from increased business volume is an indirect effect of convention and tradeshow attendee spending. Induced impact or effects are the increased sales within the region from household spending of income earned due to conventions and tradeshows and their supporting sectors. Convention center workers, hotel and restaurant employees spend the income they earn because of conventions and tradeshows on housing, utilities, groceries, clothing and other discretionary spending. Multipliers are applied to capture the size of the indirect and induced effects, expressed as a ratio of total effects to direct effects. Total effects are direct effects plus the secondary (indirect plus induced) effects. A sales multiplier of 2.0, for example, means that for every dollar received directly from a convention or tradeshow attendee, another dollar in sales is created within the region through indirect or induced effects.
To make the economic impacts easier to track, cities have determined through independent research the average spend per event visitor. You will see economic impact explained in various press releases as an annual event attendance figure multiplied by the average attendee spending. As an example, San Diego Convention Center’s marketing literature shows an annual event attendance of 824,376 with average spending of $1,179. The Impact calculation is close to $1billion.
Should Economic Impact Be the Only Measure of Success?
Achieving favorable and growing economic impact is the primary convention center goal. Those of us in the business appreciate and can parse the sometimes overwhelming impact that’s reported. Many of us know that the impact estimates are heightened and often overplayed. We all know that:
- There are show managers (typically tradeshows and consumer shows) who exaggerate attendance
- There are show managers (typically tradeshows and consumer shows) that present inaccuracies regarding the percent of total attendance from out of town.
- Event attendee spending does not apply to the city or metropolitan region as final demand and there are doubts that the proper calculations actually occur. The basic problem is with retail purchases of goods that are produced outside of the region. Only the retail margin and maybe some portion of wholesale and transportation margins should apply as final demand for the region.
For the most part taxpayers understand direct economic impact. Indirect and induced economic impact is not so easy to follow. If the impacts are substantial the evidence unfolds before them as market forces drive private investment in new hotels, upscale restaurants, and entertainment and shopping districts, all in proximity to the convention center. Adding indirect and induced economic impact without a truly convincing explanation can sometimes be a tough sell. So in answering our own question, “Should Economic Impact Be the Only Measure of Success?” yes, something more is needed. For a convention center, having a goal of improving cash flow, watching as your efforts bear fruit, and eventually achieving positive cash flow measured as EBITDA is as satisfying to convention center leadership, staff, board members, and political supporters as a large economic impact is. Favorable cash flow statements have these attributes:
- A solid ring of truth about them; they demonstrate management competence.
- They resonate well with most segments of the population who may be naturally skeptical of unusually large economic impact statistics.
- They add a legitimacy, believability and clarity to economic impact reporting. Ultimately clarity matters. Clarity leads to public support and unity of effort.
If successive years of positive cash flow are achieved, covering all cash related expenses and accumulating a capital reserve, that fact will provide a reputation lift to the convention center and city and will be regularly reported and indeed celebrated with pride.
Findings –Are Convention Centers Able to Cover Operating Expenses with Earned Revenues?
Some are, and more than you’d think. Some are closer than you’d think. All should at least try.
The research conducted is illustrative. For convention center sample we were able to find and review audited financial reports for the most recent business year (either 2014 or 2015). The sample size was smaller than desired however; many of the financial reports that exist are bundled with other public facilities like theaters, arenas and stadiums. Phone calls to convention centers were not effective; most did not have the information readily available and often ended with suggestions that we file a FOIA request. To conduct a full blown study with a larger sample size and a review of multiple years would be daunting; beyond the process delays of FOIA requests there would probably be many questions as each center has different accounting methods for classifying revenues and expenses. For example, some centers count deferred revenues (rent received for an event which hasn’t yet occurred) as operating revenues while others count it as unearned income. A detailed study would also do a more complete job of explaining why some convention centers do better than others financially as the study reviews and compares occupancy rates, service offerings and their pricing models, and overall expenses.
In general the findings were surprising. Our expectation is that we would only find one or two convention centers in the sample where earned revenues covered or exceeded operating expenses less depreciation. We found six (37.5% of total). We also found convention centers where in our judgment achieving the goal of covering expenses (“operating profitably”) seemed reachable. Given the limits of sample size, the tables below summarize findings. The tables also attempt to benchmark (using averages and medians) the occurrence of “being profitable” in calculating the following; earned revenues, operating expenses (less depreciation) and net – all per gross square foot of exhibit space; dependence on government support (normally from tourist taxes) expressed as an amount and per cent and; documenting which service offerings the convention centers provide.
Sample Convention Center Operating Cash Flows – 2014 or 2015
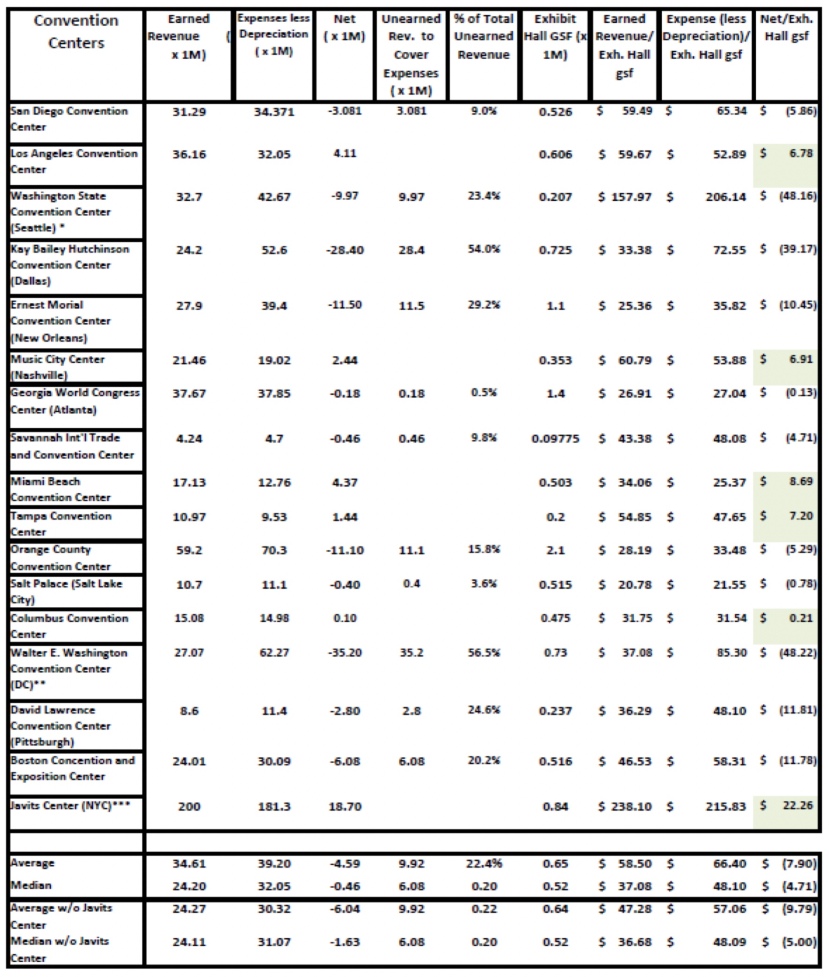
NOTES: * WSCC carries all or part of the city’s convention marketing expense of $10.4M. This expense is normally carried by the CVB elsewhere. Without this expense WSCC’s cash flow improves substantially. WSCC’s F&B is self op.
** DC Convention Center’s revenue and expenses were derived from DC Auditor’s report 2015.
*** The Javits Center could well be considered an outlier in this comparison. Center has a high client demand, books all its own business, rarely gives rent concessions and has a full range of high value services including labor provider to General and Exhibit Appt’d contractors
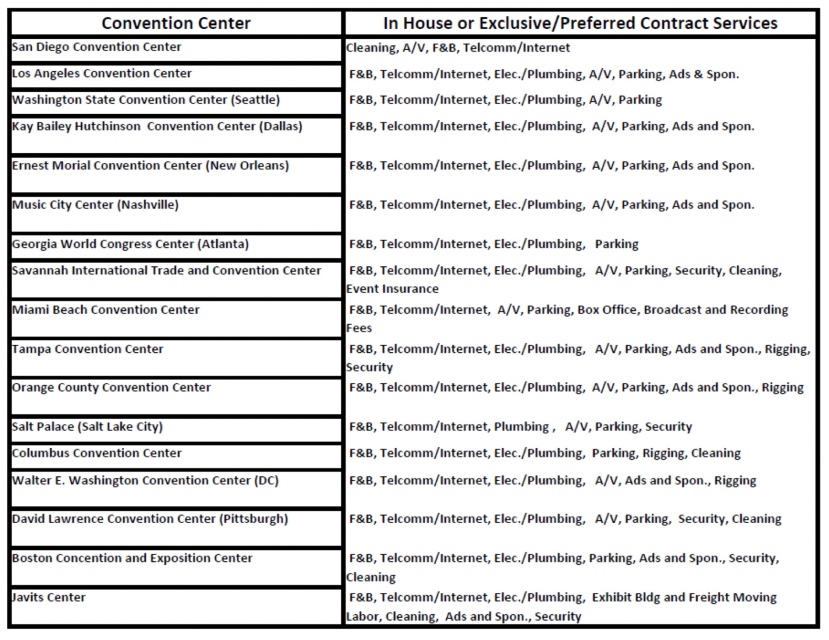
Sample of Convention Center Major Service Offerings
Statistical Inferences
- If the Javits Center is taken out of the analysis as an outlier, then four of the five convention centers that covered expenses with earned revenue had both earned revenue per square foot of exhibit space above average and expense per square foot of exhibit space below average.
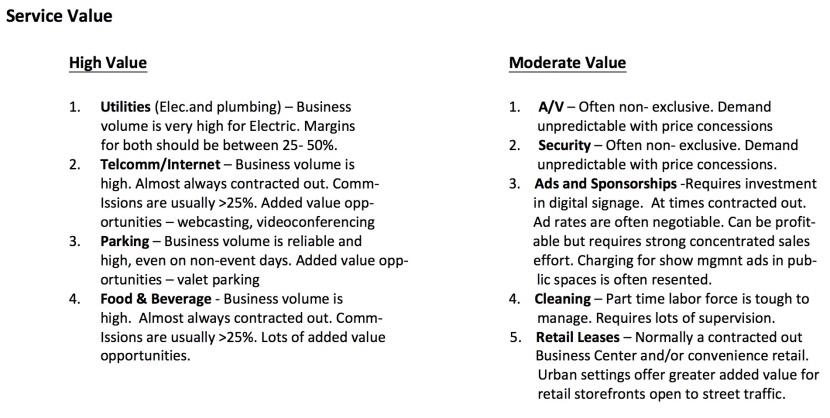
- If the Javits Center is taken out of the analysis as an outlier, then four of the five convention centers offered the high value services of F&B, Utilities (elec. and plumbing), Telcomm/Internet, and Parking
- Of all the convention centers that covered expenses with earned revenue, four of the six had a known occupancy rate above 65%. There is a strong inference that convention centers with a favorable occupancy rate (over 60%) which offer a full range of high value services (especially utilities) have a much greater probability of covering operating expenses.
Conclusions and Recommendations
- First let me commit a bit of heresy and say that I disagree with the oft repeated phrase “convention centers are not designed to make a profit”. I consider it one of the more ill advised management declarations in the convention center business. My view as a former GM is that talk like that will discourage creativity and any entrepreneurial spirit your staff may have.
- The research and findings for this piece are encouraging. There are good examples of cash flow improvement and coverage of operating expenses with earned revenue. One of the better examples is the work of a private convention center management company, AEG Facilities. They’ve taken the step of thinking and acting strategically in announcing that covering expenses with earned revenue as a primary goal for their clients. They made it policy and they met that goal at the Los Angeles Convention Center for successive years. They have been able to increase occupancy from 55% when they assumed management in Dec. 2013 to 72% currently, a notable turn around. It has been recently reported that for FY 2016 that Los Angeles Convention Center achieved an $8.1M operational surplus. Additionally, similar progress has been made at the Hawaii Convention Center which AEG Facilities also manages. The Los Angeles Convention Center has retained the profits and funded the center’s own capital reserve. It is often surprising how rapidly the fund accumulates cash. At some point a convention center can reach a level of self sufficiency where technical improvements can keep pace with the market and deferred maintenance doesn’t grow out of control. AEG Facilities accomplished this with cost cutting (principally payroll), renegotiating terms, commissions and price schedules for contract services, and aggressively filling open dates with film and photo shoots and consumer shows.
- AEG Facilities’ effort will probably represent a change in the way private management companies compete. Normally private management proposals are strong on cost cutting measures which they can all do consistently well. Rarely is there a stated and clear objective of covering operating expenses with earned revenues in privatization proposals.
- We reviewed many service order forms and found some meaningful price differences among convention centers in the same region serving the same market sectors. Recommend that a pricing audit be conducted and see how you compare to current market prices. Perhaps you have more pricing power than expected.
- In several of the audited financial statements there appeared a line item entitled “rent credit”. We learned that this was a way of accounting for rent discounts and rent free events. Rent credits are classified in financial statements as unearned revenue and are, from what we have learned, non-cash revenues, i. e., convention centers do not actually receive a partial or full reimbursement. Some of the credits were substantial. For example, the Los Angeles Convention Center posted 2016 rent credits of $6M. Rent credits occur mostly with association meetings and exhibits. These terms are negotiated by CVBs. This happens whenever there is a ”citywide” event measured by the number of anticipated hotel rooms needed. The usual offer to clients is zero rent. Zero rent became common in the early 2000’s. The dot com bubble had burst, more exhibit space was coming on line and cities were concerned about losing market share. Then 9/11 hit and the recession followed in 2008. Now, zero rent is a common negotiating tactic, especially for professional associations. I believe convention centers are making it too easy for CVBs to offer zero rent on proposals for these reasons:
• It is wrong that one organization crafts transactions that are not particularly
beneficial to the organization that is ultimately accountable.
• Generally competing on price alone diminishes the perception of your city’s
brand and creates an impression that event locations are like commodities;
one is as good as the other. Indeed cities and convention centers are not.
Reasonable price competition can work, but once you start leading with
price, especially zero rent, the expectation is that you will do it all the time.
Challenge CVBs to offer better justification for zero rent. Force them to obtain more corporate intelligence about the client’s real intentions; is coming to your city a real market advantage to the client zero rent or not, for associations – is your city part of a predictable rotation increasing the probability of a booking, are there less costly value added parts of a proposal that all together are as attractive as zero rent. Additionally engage in conversations with the general decorating contractors, hoteliers, board or advisory association members from your city and key exhibitors from your city. This takes hard work and finesse but clear information about location decisions are sometimes revealed.
For convention centers interested in improving cash flow, consider the audit services that MTMConsult, LLC can provide. The audits can be scaled to fit your situation and are reasonably priced. Our team of experienced practitioners with real field experience will drill down to the important details and provide actionable results.
Email us at advisor@conventioncenternow.com or call – 203-273-6999
Starting and Expanding Advertising and Sponsorships as a Revenue Stream
Why Is this a Good Idea?
I have often been confused why more convention centers do not actively engage in an advertising and sponsorship program as a revenue stream. Perhaps it’s viewed as a business more appropriate for others; sports and entertainment venues are the logical setting for advertising and sponsorships, not convention centers. Sports stadiums and arenas and their tenant teams – football, baseball, basketball, hockey, etc., all have a loyal fan base and fans are very emotionally connected. Television and radio coverage are integral parts of the sports experience. These things don’t exist at convention centers and convention center management may not feel it’s worth the effort. I also believe there’s reluctance by some convention center management to use ad space and media that were once exclusive domain of event managers and then, charge fees and commissions for features that were once free.
My belief is that if convention centers who feel this way would conduct a thoughtful evaluation of the benefits and risks, they may change their minds.
Benefits – A well crafted ad and sponsorship program:
- Contributes a level of legitimacy with respect to the convention center being a place of business, where new products and services are rolled out and demonstrated in a setting where comparisons can be made, where deals are done, where technical and scientific information exchanged, and where like minded professionals can network and socialize.
- Strengthens the business relationships with others in the city hospitality sector. Restaurants, hotels, nightclubs, shopping districts, and other cultural and entertainment venues are likely advertising and sponsorship candidates. Having the relationship solidified by an advertising agreement helps achieve that. The character of the relationship would be different; it won’t be casual or shallow anymore, it will now be business.
- Can become a reliable revenue source which may waver up and down with the vagaries of the economy but can grow in stable and growth years. There are a few convention centers where an advertising and sponsorship program has contributed between $1 – 2 million to the bottom line annually.
Risks –
- Know that many times brands are judged by the company they keep; remember this, it will come up again. Many times an advertiser or sponsor’s business issues, such as product problems, legal issues, and financial problems become your problems. This is especially true if it’s a naming rights sponsor. Choose potential advertisers and sponsors wisely. Understand that advertisers and especially sponsors may view the convention center similarly. Convention centers are accountable to them for bad publicity and for routine items such as signage and website maintenance, or for the overall condition of the facility. Sponsors too will always be interested in their return on investment and review the returns periodically.
- An overly aggressive ad and sponsorship program can pose some problems with your trade show and association meeting clients; too much signage by advertisers takes away from space available for an event’s trade dress signage and decoration and their own sponsor advertising, inflexible terms regarding advertising and product exclusivity by sponsors may interfere with an events’ exhibitors or their sponsorship sales. Also, critics may argue that over-commercialization with garish signage and endless brand messaging detracts from the convention center’s mission. It’s best to exercise good taste and a sense of propriety here.
- An advertising and sponsorship program is very visible to others and potential event clients. An ineffective and feeble program where advertisers and sponsors are few detracts from the center’s reputation. If, after evaluation, you do not believe you can achieve revenue goals and visibility then perhaps you should forego the effort.
Taking Stock – What Is Your Inventory of Advertising Possibilities and Media?
Exterior –
- The Center’s Location – Is it located by and in view of major traffic thoroughfares? If so, call the municipality and obtain a daily traffic count. Pedestrian counts may also be available.
- The Center’s Architecture – Normally the entrance is a piece of landmark architecture. The curtain walls are high, there is usually an array of light or flag poles along the entrance drive, and the adjacent sidewalks are wide. All are possibilities for banners and signage.
- Fixed Static or LED Signage (usually located by the center’s entrance) – These signs normally announce the event(s) in-house, but have fixed signage possibilities as part of the sign structure or in the case of an LED sign, use possibilities due to the technology.
Interior –
- Center entrance, atrium, lobbies and concourses – All have high curtain walls and space frame features for banner hanging
- Well trafficked corridors – Recommend a limited number of high quality back-lit signage
- Center video screens – Large video screens are best located in the expansive entranceways, atriums and lobbies where the scale fits the setting. Smaller video screens are more appropriately located along well trafficked corridors, retail areas, taxi/shuttle bus waiting areas and food courts. The screens are normally part of a network, complete with a control room, equipment room and the capability of running different messaging (pre-programmed) for each screen.
- Columns in atrium and lobbies
- Public stair risers – Normally temporary and done with 3M product with adhesive back
- Escalator side panels and railings
- Taut cables over escalator wells for banner hanging
- Displays adjacent to Information and Concierge Stations
- Ads and wraps at water coolers and phone/tablet charging stations
- Food Court table tops – Using the same adhesive backed 3M product
Digital/Print –
- The convention center’s website – Banner ads, column and button ads on the most popular pages (event schedule, public transportation and driving directions and map). A restaurant directory as well as one for hotels, nightclubs and other attractions should be part of the website. Some convention center websites do an excellent job of posting these directories. View the San Diego Convention Center’s restaurant directory:
http://www.visitsandiego.com/attendees/restaurants.cfm
- The center’s mobile app
- The center’s WiFi Portal (opening page)
- Blogs, newsletters, annual reports, direct mail pieces
- The center’s social media (Facebook page, Twitter Feeds, Instagram, YouTube, etc.)
- Exhibitor Manuals and Order Forms
Other –
- Opportunities to publicly display product – A luxury car in the center’s atrium is a good example
- Collateral reading material and brochures at concierge/information desks
- Portable cups and napkins in the food courts
Reserving Inventory Exclusively for Events – How much inventory should be reserved for them? The short answer is – any place public that has height and visibility (exterior, curtain walls, light poles, etc.). A well organized center will publish a guide with diagrams showing locations and standards for sign and banner hanging.
Charging Event Management Fees for Advertising Outside of Their Licensed Space – This is an excellent revenue source, at times comprising half of the center’s ad and sponsorship revenue. Most event managers already use most available locations. Besides their own trade dress and directional banners, in many instances they use these locations to sell advertising to their event sponsors, normally in the form of large fabric banners, stair risers, free standing displays, etc. Ten years ago most convention centers permitted events to sell ads to exhibitors using all the aforementioned media and signage without paying location fees to the convention center. I am pleased to see that many convention centers have ceased this practice and now charge fees and commissions. Convention centers which still offer this for free should be well advised to stop the practice. As controversial as it may seem, the architectural prominence and visibility that was created by public investment and the value it creates for such things as advertising banners gives convention centers clear entitlement to reasonable fees. Use of public areas for the sale of advertising to others is normally not part of the event manager’s license agreement. Fees should be a percentage of fees collected by the event managers from their client (say 15%). In the case of public space banners, the percentage arrangement is sometimes not satisfactory. For convention centers, it’s much easier to audit and collect based on size. Exterior banners should be charged a higher rate (say 20%). Ads for other media, such as the Center’s Wifi hotspot “splash” page, use of the Center’s monitors, food court table tops, etc. should be negotiated at market prices.
What’s the Difference between Sponsorships and Advertising?
A corporate sponsorship is a form of marketing where companies connect their name, brand, and products and services to a venue for long term in order to enhance their brand, solidify and expand their markets, showcase their products and achieve future profits. It should not be confused with advertising which is direct and overt and contractually a shorter term. In sponsorships, advertising through signage is inclusive, just one element in a sponsorship plan. A well designed sponsorship generates a stronger and more subtle message. It tends to be more qualitative and has loftier goals than just customer exposure and sales. It is a marketing platform where a company can identify with the best aspects of its partner, where a company can build credibility, prestige and, create a more permanent, lasting bond with consumers.
Who Are the Potential Sponsors?
It’s useful to first separate potential sponsors from ad hoc advertisers. Sponsors should be companies that have a tangible connection and can be easily integrated into a convention center’s core business and culture. There are however more subjective considerations. There has to be the proper feel and fit. It’s difficult to define but it comes down to whether the corporate image is one that complements the convention center, the city and vice versa. While the company should obviously be prosperous, they also need to have a certain brand reputation for reliability and quality, and a high corporate standard for civic responsibility.
Certain industries seem to fit as ideal sponsorship candidates. They are; an airline with a regional or national hub at the city’s airport, a major credit card company, a regional bank which has a solid customer and investment base in and around the city, a utility, a major technology/telecommunications company (preferably one that designs and manufactures, and operates equipment), a media company (preferably local newspaper or TV station), a luxury car company and a long standing major employer for the region. If your convention center is large and busy, then a soft drink sponsor, with exclusivity for advertising and product sales (pouring rights), also makes sense.
Some sponsorship marketing consultants, such as Jim Andrews from ESP Properties in Chicago (www.sponsorship.com) favor technology companies above others. His view is that these companies are in a growth mode, spend heavily on marketing and are generally open to venue sponsorships often seeking these opportunities out, particularly sports and entertainment venues. Another consultant, Hugh Wakeham from WAM Associates in Toronto (www.wam.ca/) believes similarly but also sees regional banks and utilities as excellent candidates. He described an interesting case study of naming rights where a utility company Enercare has naming rights to the convention center at Exhibition Place in Toronto. Enercare uses this sponsorship to demonstrate and promote Green technologies. On site for instance, windmills generate electricity and electricity, hot water/steam and chilled water are generated by a gas fired Tri-Generation power plant.
Sponsors will of course require something more than company name and brand exposure through signage. It is useful to have a list of other things that a sponsor could benefit from such as; exposure on your digital media (website, newsletters, blogs, twitter feeds and WiFi portal, etc.), free passes and parking to popular events that they can distribute to employees and clients, free use of public space to show or demonstrate a product, credits for rent, parking and F&B for an event like a corporate sales or board meeting. You may have to be creative here. As mentioned earlier sponsors pay close attention to their return on investment. There are items the convention center can track on their own such as product sales on site if applicable and hyperlink openings and page views. It is very likely that a sponsor may ask and possibly tie the result to renewal and fee negotiations. In my time at the Javits Center, it was common for our soft drink sponsor, Coke, to conduct a business review and focus on cases sold per year. The Director of Marketing and Communications at the Shaw Centre in Ottawa, Sylvie Carbonneau, described how their luxury car sponsor, Porsche/Audi, tracked sales based on their car displays at the centre.
For convention centers a successful sponsorship consists of cash and/or a capital contribution (which could be cash or in-kind – telecommunications/internet equipment for example), some accommodation for day to day operations (airline ticket credits for business travel or discounted utilities), cooperative marketing when these opportunities come up and a long contract term 3 to 5 years with renewal options.
Who Are the Potential Advertisers?
A quick list should show the categories below and be accompanied by a map denoting walking time from the convention center and headquarter hotel (normally 15-20 minutes):
- Restaurants – These can be categorized by type of restaurant, ratings of same, price point and distance from major hotels and the convention center
- Hotels
- Parking Lots and Garages
- Shopping
- Nightclubs
- Attractions
- Professional Sports Venues
- Concert Venues
- Theaters
- Cultural Attractions (art galleries, museums, historical sites)
- Beer
- Wine
Other advertisers could be car rental companies, an office and hardware retail outlet, exhibit service companies – general decorating companies, exhibit appointed contractors, A/V companies, computer/technical supply retail outlets. Advertisers, especially in categories where there are many like restaurants, are typically put in easy to read directories which accessible through the center’s website, mobile app and WiFi portal. In my experience, advertisers normally didn’t track ROI closely. As with sponsorships, the convention center should track hyperlink openings and page views because it is likely that an advertiser may ask and possibly tie the result to renewal and fee negotiations.
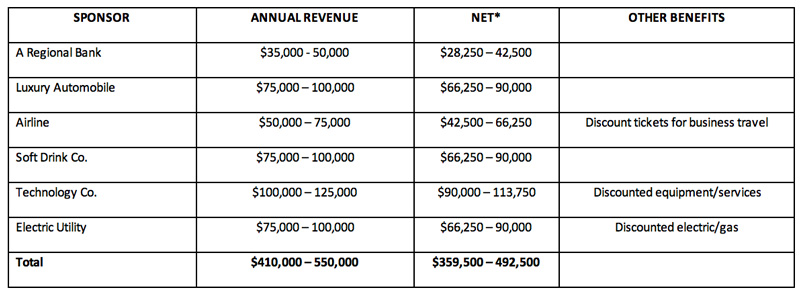
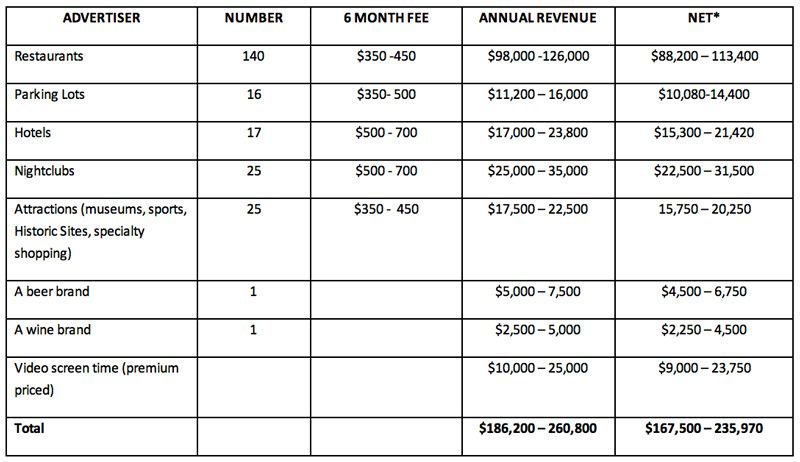
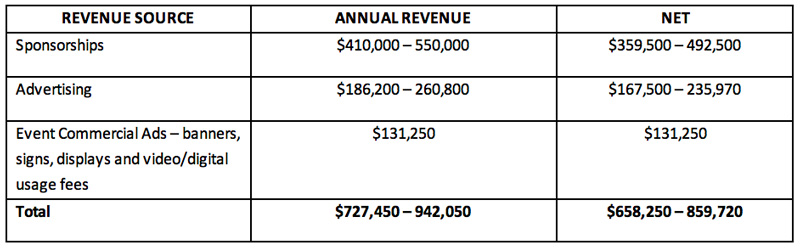
A Sample Pro Forma
For the example below:
- Sponsor revenue is based on the Javits Center experience and informal conversations with other convention centers in my consulting business.
- Advertising revenue is based on my time at the Javits Center and price schedules from convention centers published on the internet. The number of restaurants, parking lots, hotels and attractions is based on those published on the Davis L. Lawrence Convention Center (Pittsburgh) website.
- Revenue obtained from fees for commercial advertising sold by event managers in public areas and video/digital media is estimated based on the Javits Center experience. Assume that the center’s occupancy in this example is high, say 60-65%. It was then estimated that 15 events would sell exhibitor advertising in public areas of the convention center;
10 events x $50,000 in sales = $500,000 5 events x $75,000 in sales = $375,000
$375,000 x 15% fee = $56,250 $375,000 x 15% fee = $56,250
$75,000 = $56,250 = $131,250 (estimated total)
*Venue obligation includes;
On-site signage, possibly on-site retail
On site video time – large and small screens
Product exclusivity, possibly advertising exclusivity (w/qualifications)
Website Ad
Social media exposure (Facebook, Twitter, Instagram, YouTube)
Mobile APP Ad
Rent, F&B, Parking Credits
Free passes to public events
Cost of above –
– Sales Comm – 5%
– Credits (lost revenue) – $5,000
*Venue obligation includes;
Website Directory
Social media exposure (Facebook, Twitter, Instagram, YouTube, etc.)
Advertising exclusivity for beer and wine
Mobile APP Directory
WiFi portal directory
Concierge/Information Booth Display and Menu Catalog
On site video time large and small screens – not included in 6 mo fee schedule above; pricing should be at premium levels
Cost of above –
– Sales Comm – 10%
How to Get Started – Logical Next Steps
Assuming you have already weighed the benefits and risks and reviewed the market size for sponsors and advertisers, these are logical next steps:
- Obtain price schedules from other convention centers that have an active advertising and sponsorship program in place.
- Build your own pricing model
- Build a pro forma statement
- Determine who will do all the administration and sales work. Understand that the sales work is hard work; developing marketing material, making cold calls, making site visits, and price negotiations. Add to that having patience; it will take more than a year to build revenue. Options are; outsourcing, Integrating the responsibility into existing sales force or add to staff with a new hire
- Obtain board approval in the form of a policy statement. This is important for two reasons; board members are a good resource for potential sponsors and advertisers and obtaining advertisers and sponsors may be regulated by government procurement procedures which really do not apply to this business function, board approval may help avoid this.
- From the city government, obtain traffic counts and pedestrian counts for adjacent streets and sidewalks. From your website administrator obtain internet traffic statistics. Invest in a survey to develop a demographic profile of attendees who normally come to events at the convention center. Typically they are business men and women between the age of 30 – 45 with a higher than average annual income.
- Develop marketing material. The link below from the Shaw Centre in Ottawa is a good example:
http://www.shaw-centre.com/wp-content/uploads/2015/12/SHAW-1527876_Advertising_Possibilities_EN.pdf
- Develop a face to face marketing message and a sales plan. The marketing message should be one of optimism, one that emphasizes positive changes such as an expansion or renovation, or an investment in video screens and digital technology, or the organizing of a staff to administer and look after the needs of sponsors. Persuade them of your resolve; show them that there is a parity of commitment, that the convention center has “skin in the game”.
- Begin work and monitor progress
All About Convention Center Naming Rights
Establishing Naming Rights Value
It’s easy to be lured into believing that naming rights as a financial bonus for convention centers. Decision makers may be influenced by media reporting and tend to overlook that only the global level deals are reported. They hear about deals like the Barclay Center ( Brooklyn Arena-Brooklyn Net home w/18,000 seats) valued at $200M over 20 years or the American Airlines Center (Home of NBA’s Dallas Mavericks) for $195M for 30 years. In these instances they must realize that the team’s market area is significant with a fan base which is loyal and reliable and stretches to anywhere television and radio can reach. Still, it’s hard not to think about the possibilities and I believe, beyond the blockbuster deals, at some point linear thinking takes over. They see their hometown arena achieve a significant naming rights deal in a small market area and they start thinking and believing their convention center can do likewise. As an example, the Chesapeake Energy Center in Oklahoma City (home the NBA’s Thunder w/18,000 seats) obtained a naming rights deal of $36M for 12 years. The Cox Convention Center across town has 100,000 sq. ft. of exhibit space and a 15,000 seat arena (w/ minor league hockey and an arena football team) and obtained a naming rights deal valued at $1.7M for 7 years, nothing linear about that. Linear thinking doesn’t work when comparing naming rights values to major league sports.
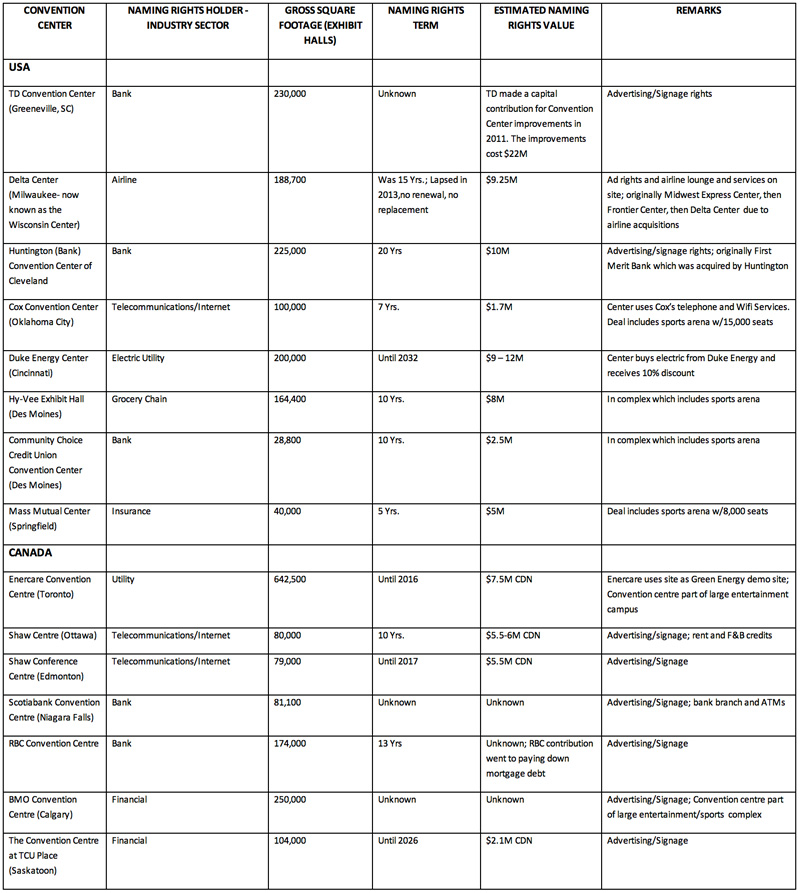
Linear thinking doesn’t appear to work when comparing the values of existing naming rights deals for convention centers either. If you study the table below you will see that it is very difficult to see any sense using valuation methods (cost, income or market valuation) when it comes to establishing a convention center’s naming rights value. The comparisons are too few, the market sizes and the venue sizes too diverse to see patterns. Additionally some relatively small markets have achieved surprising value; the HY-Vee Exhibition Hall in Des Moines is a good example ($8million with a term of 10 years).
From the current number of naming rights deals (14) the following characteristics are evident:
- Naming rights deals were closed during or after new, expanded or major renovations took place.
- The core market areas for most companies holding naming rights are regional. One reason to pursue naming rights is to maintain and solidify the markets they already have. For those who are not historically regional, their eye is on expansion to new regional markets. This was the case for naming rights deals in Niagara Falls, CA – Scotiabank Convention Centre and Ottawa CA – the Shaw Centre.
- Most are for 2nd tier markets in the US. I am convinced that convention centers in 2nd tier markets in the US are the best naming rights candidates.
- Proportionally Canadian convention centres are more likely to pursue and successfully close on naming rights in 1st and 2nd tier markets than the US
- The financial sector (banks, finance companies and insurance) have the highest percentage at 57%, technology companies next at 22%, then utility companies at 14%. At one point an airline held naming rights but that contract has lapsed.
- About 40% of the naming rights holders were acquired by other companies during the naming rights term. Expect name changes.
What’s in a Name?
For a convention center, I think there’s a whole lot in a name. It may sound trivial and shallow but the sound and the emotional response of a name can result in a name that can be so inappropriate, awkward and some say hideous that it is cause for public embarrassment and ridicule. There are many examples; The KFC YUM! Center in Louisville, Whataburger Field in Corpus Christi, Smoothie King Center in New Orleans and the Bargain Booze Stadium in the UK. Fortunately none of these venues is a convention center. One convention center in Des Moines had a naming rights deal with the final name being the Veteran’s Memorial Community Choice Credit Union Convention Center. In my opinion the name is an awkward mouthful. Common sense prevailed in this instance and the exterior sign remained The Veterans Memorial with the longer version seen less prominently in the interior of the facility.
The Inherent Difficulties for 1st Tier US City Convention Centers Pursuing Naming Rights
The success rate shows and I am convinced that convention centers in 2nd and 3rd tier markets in the US are the best naming rights candidates. Not long after new management took over the operation of the Javits Center in 1996, a private conversation regarding Javits progress took place where I was present. .By chance the subject of naming rights came up. Business at the center was turning favorable rapidly and the idea of naming rights seemed a natural. The conversation ended but no subsequent actions were discussed or planned. Within days, a bill was introduced in the NY State legislature prohibiting any attempt for a name change to the Jacob K. Javits Convention Center. I am certain no one at the meeting talked about it and clearly the draft of that legislation was prepared long before our meeting took place. So I learned how these matters evolve. I believe wise and experienced convention center managers at 1st tier convention centers know in advance the likely outcome if naming rights are aggressively pursued. If the center bears the name of a beloved and respected political leader, alive or dead, the effort will be mired in controversy. Potential naming rights sponsors will steer clear of the controversy and convention center leadership will be happy to oblige. If the center only bears the city’s name it is possible that the potential deal value will drive an action plan. Expect pride of place advocates to object to a name change. If that doesn’t discourage the effort, government procurement procedures pose another impediment. Acquiring naming rights is not on any company’s annual marketing budget. Candidates for naming rights have to be courted and persuaded; a process that does not fit into the typical RFP process. This process needs to be conducted quietly whereas the RFP process is blatantly public and gives cause for a company to decline to bid. Convention centers should also seek out the services of a marketing consultant, one who has closed naming rights deals before and understands the language and nuances of naming rights valuation. In my experience and in all the research I conducted, none of the naming rights deals closed by following a traditional RFP process and most sought the help of a marketing consultant.
Recommendation – An Alternate Idea to Full Facility Naming Rights
There are some excellent examples of convention centers where portions of the centers are offered for naming rights. The David L. Lawrence Convention Center in Pittsburgh sold rights to its 34,000 sq. ft. ballroom to Dollar Bank for $1M and a term of 5 years. The Dollar Bank graciously named the ballroom “The Spirit of Pittsburgh” and installed several displays depicting the history of Pittsburgh throughout the center. At the Colorado Convention Center in Denver naming rights to its 5,000 seat concert theater were sold to Bellco for $1.25M at a term of 5 years. There are discrete and iconic architectural spaces that have naming rights potential in many convention centers; an elegantly designed ballroom, an outside terrace or garden used for special events, an architecturally prominent lobby, a new meeting room suite or technologically advanced boardroom. Convention centers which are very large and subdivided into separate buildings offer unique opportunities for naming rights. Imagine the four principal buildings of McCormick Place (the North, South, West and Lakeside Center) bearing corporate names. The tradition and integrity of the McCormick Place name stays in place and an excellent revenue prospect is exploited. I see similar possibilities at the Orange County Convention Center, the Vancouver Convention and Exhibition Centre and the Moscone Center.
Service Profit Centers at Convention Centers – Electric Services – How to Evaluate Current Business and Improve Revenues and Profit
In today’s convention centers designers have specified electrical capacity and distribution to service any event in the market with respect to electrical demand per square foot. They have truly “built the church Easter Sunday”. The distribution network is uniformly distributed in floor boxes across exhibit halls for 110/208V applications and there is usually a high voltage (460V) bus or connection panel overhead to handle discrete heavy electrical loads or to supplement floor box capacity. In my experience I have only seen a capacity problem a few times and that was just for an exhibit hall, not the full facility. Normally for events, convention centers experience a high diversity factor. Diversity factor is defined as: Total Connected Load/Actual Maximum Load and it demonstrates the degree in which surplus electric capacity was designed and built. The investment in the electrical infrastructure; floor boxes, distribution cabling (embedded in exhibit hall floors), distribution panels, transformers, switchgear, and high voltage feeders (with capacity redundancy) is substantial and rarely fully utilized. The recurring costs of cleaning, maintenance and periodic testing is significant also.
How Are Electric Services Rendered for an Event?
A team of electricians normally begins connecting, labeling and laying out cable for each exhibitor ordered service, directly following exhibit booth mark-out. Cables are coiled and labeled at the back end of each booth or laid out, taped down and positioned in accordance with exhibitor plans. The usual service is one plug-in point and services are sold in that fashion. High voltage service requiring an overhead cable drop is normally supplied at the same time. Other services; connecting exhibitor equipment, installing rented lights, and dressing wires are completed during construction of the exhibit booth. For a well organized team, the fulfillment of advance orders before the event commences move in can be done efficiently, before freight move in is well underway and detailed exhibit building begins. Fulfillment of electrical orders received on site is of course more difficult and time consuming. Labor is by far the largest cost element in rendering electric service, other cost elements, materials, supervision, electrical consumption and administration are relatively minor.
Electric Services as a Convention Center Profit Center
Electric service ranks in the top three or four profit centers for convention centers along with rent, food & beverage sales and internet/telecommunications. It’s a reliable source of revenue and necessary to reduce dependence on subsidies to cover operating expenses. If your center has the opportunity and drive to reach a position of needing no subsidy – where earned revenue will cover expenses and then some, your team will need electric services to achieve that goal.
There are three typical business arrangements:
- Self Operation (also referred to as “in-house”) – The convention center provides this service through their own utilities division. The division is responsible for all aspects of the business; management and floor supervision, administrative of service orders, obtaining a labor force with all the HR functions included (hiring, firing, training, payroll, etc.) , material purchasing and inventory control, planning and implementing event installation, customer service, and probably a great deal more.
- Exclusive Electrical Contractor – Convention centers may choose to have an exclusive contract with an electrical contractor. The choice of contractor is normally the result of a competitive process. The process is characterized by rigorous due diligence which examines all the aspects of operating a service business. Final selection often requires approval of the board of directors. Commission rates range from as low as 12% to as high as 35%. Occupancy and the nature of booked events clearly influence commission value.
- Open (Show Manager’s Choice) – This choice is not as open as the phrase implies. Convention centers normally must approve the contractor and many already have a list. Los Angeles Convention Center for example has three approved contractors. Sometimes the center will issue a “preferred” list of contractors. The review or vetting process for approval usually covers items like a financial review, a safety record review and adherence to required union collective bargaining agreements. Most convention centers require a fee or commission on gross revenue be paid by the contractor to the convention center for use of the facility.
Pricing of Electric Services
Most convention centers and/or their exclusive electrical contractors price their services on a market basis. Convention center management recognizes that cost- plus pricing, while simple and easy to justify, is not an effective pricing strategy. Cost- plus ignores competition. A convention center could decide on service prices based on the cost- plus formula and then be surprised when it finds competitors charging substantially different prices. This can unfavorably impact on the profits a center can expect to achieve or put their market share at risk due to high prices. The center either ends up pricing too low and giving away profits, or pricing too high and experiencing an erosion of revenues.
A typical price schedule sets prices in accordance with different operating voltages and electrical demand (watts) for 110/120 Volt service and in current (Amps) for 208 and 460 Volt service. For the later there is a premium placed on three phase service. The prices of course vary from city to city and it’s evident that consideration is given to the pricing of regional and national competitors. Rental items such as plug-in strips or display lighting are also priced on a market basis. At first glance of an electric service form these prices appear as a flat fee. It’s the application of labor charges to these flat prices which make things confusing and questionable; often a source of resentment from exhibitors. Hourly labor prices (which are wages, benefits, taxes plus a mark-up) are high considering the rudimentary level of skill and training required. Some convention centers, Boston Convention and Exhibition Center, the Javits Center, the Orange County Convention Center, the Austin Convention Center, the Indiana Convention Center include labor in the price of all 110/120V, 208V and 460V service. From a customer service view this is a wise and politic pricing strategy. There is predictability for exhibitors and there is no uncertainty or distrust of labor productivity. The margin risk is all on the convention center.
Which Business Arrangement Fits Your Business Model and Financial Goals?
There is a tipping point where self operation of electric services makes the most business sense. It would require a favorable history of occupancy and electrical revenue per net square foot with reliable forecasts of consistency and growth. As a rough estimate, I believe the tipping point would be an occupancy rate of about 50% where the majority of the events are trade and consumer shows or conventions with exhibits. Otherwise, the sensible course is to retain an exclusive electrical contractor, large enough to sustain business due to work elsewhere. The contractor must be able absorb the overhead required to keep the convention center arm active and to reliably organize a capable work force for events.
Convention centers contemplating a transition from an Open arrangement to an Exclusive Contractor or Self Operation will find a more challenging situation. The Open arrangement typically exists in convention centers which are large with excellent occupancy, and well booked with trade and consumer shows and conventions with exhibit floors. It exists in Las Vegas, San Diego, Los Angeles, Anaheim and San Francisco. It also exists in Miami Beach and Chicago at McCormick Place. The Open arrangement is an attractive bonus for tradeshow managers as most contractors working directly for the show pay show management a commission on revenues received from exhibitors. Convention centers too often demand a user fee from whatever electrical contractor the show manager selects, dividing the contractor’s revenue further.
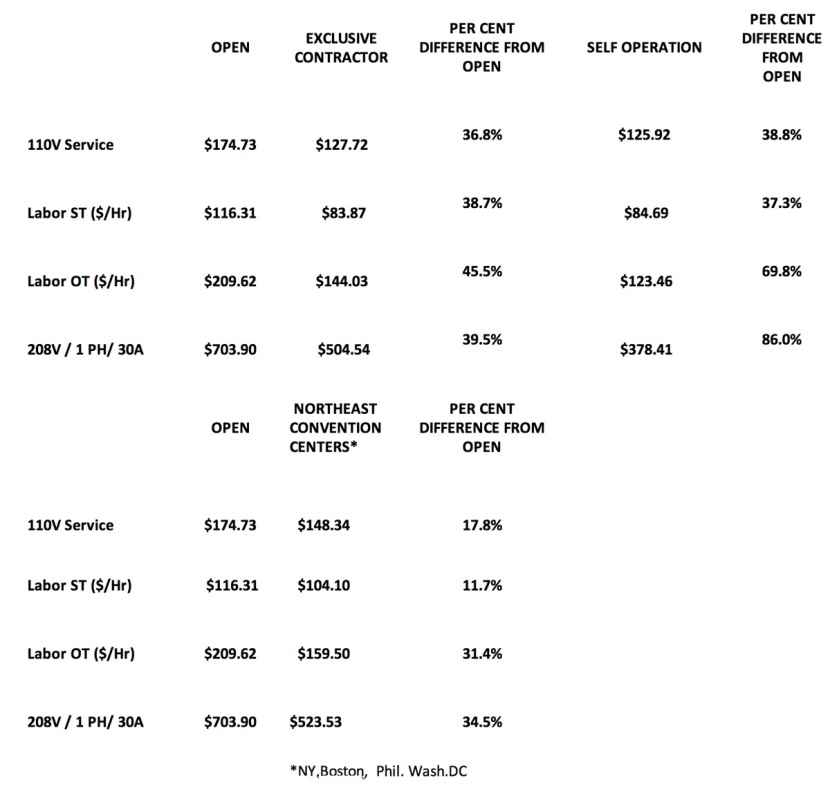
There will be controversy surrounding the decision if a center elects to change certain businesses from Open to Exclusive or Self Operation. There has been one recent controversy that became very public. The example often cited is the dispute between the San Diego Convention Center and United National Maintenance. It involved transitioning from an Open business arrangement for event cleaning services to Self Operation. The dispute carried on for years through the courts and then to an Appeals court before the ruling came supporting the convention center. Negative publicity was aggressive and shrill. Tradeshow advocacy organizations (SISO, ESCA, IAEE) all offered support warning the San Diego Convention Center’s actions would “….. most likely will cause organizers to look for more user-friendly venues “ and “create an open door policy that will allow the center to institute new practices of exclusivity that can reduce service and increase costs to all parties.” The outcome has been that the San Diego Convention Center is still a venue in great demand and has just finished their most successful year. The irony is that none of the assertions about service quality and high prices are true. Convention centers which have an Open arrangement for electric services are by far the highest prices nationwide (see table below). We researched several price schedules for each Open arrangement and it was rare that we found service and labor prices set at a value to help exhibitors (see table below). Additionally, it was evident that certain business practices such as piling on high priced labor to 110/208 or 460V service, charging absurd labor prices for service ordered while on site, insisting that all electrical work, no matter how rudimentary, is the jurisdiction of their electricians, are the norm. A review of current service order forms nationwide showed these practices slowly disappearing from convention centers which are handled by Exclusives or are Self Operation.
In the table below note that the 110V prices are composite prices based on historical service order proportions at the Javits Center; 500W – 52%, 1000W – 24%, 1500W – 16.5%, 2000W – 7.5%.
Considering the business volume in trade and consumer shows at some of the convention centers the prospect of changing from Open to Self Operation is very attractive. The pricing could be moderated and stabilized somewhat, service prices could become flat rates, the time and material charges could be eliminated, center management would have another fee that could be used during negotiations to attract new business and of course profits in excess of the fees already received are a certainty. The legacy of current pricing and the fact that revenues are not divided up for commission and fees to others make it so. Self operation would give the center better control over staffing, better negotiating leverage over the union work rules and better control over circumstances where there is a series of events with compressed move in time. I acknowledge that this would be a tough decision. Perhaps it is in your best interest to leave things alone, allow the shows another opportunity to profit. I personally have seen shows which were having great success at the Javits Center, take the risk and choose another city and venue where rent concessions were offered that Javits would not match. Above all the advantages New York had, more attendees, more exhibitors, more media attention, profit mattered most. My advice if you are considering such a move is to be impeccably well prepared, prepare your board leadership for the criticism and over-the-top claims from the trade show industry and trade show press, prepare your legal team for some form of legal action, be strong and assertive when the dialogue gets out-of-bounds both in fact and tone and conjure up a little intestinal fortitude.
Ways to Increase Electric Service Revenues and Profit
Understanding, Evaluating and Acting on Your Pricing Power
For those unfamiliar with the term “pricing power”, Investopedia explains it like this,
Pricing power is an economic term referring to the effect that a change in a firm’s product price has on the quantity demanded. Pricing of that product power ties in with the Price Elasticity of Demand. Generally speaking, if a company doesn’t have much pricing power then an increase in their prices would lessen the demand for their products.” In this circumstance, demand elasticity may be seen in certain exhibitors choosing not to exhibit, or a reduction in the size and complexity of exhibit booths, or worse – an event manager re-locating to another city and venue because of high prices.
Comparing Base Pricing – Shown below are two examples (Orange County Convention Center and Austin Convention Center) which were chosen because they were clearly underpriced compared to regional and national competitors. The examples also demonstrate how pricing power can be evaluated.
- Orange County Convention Center – The Orange County Convention Center has a 9.6% market share of “Top 250” trade shows and conventions, ranking 2nd in this highly competitive market. The facility is a formidable competitor nationwide for many economic sectors. The analysis below shows how the center ranks with respect to electric service pricing when compared to direct competitors for Top 250 events and major medical events that rotate annually from city to city. It’s important to note that in both examples market share and the price of electric services had no statistical correlation, i.e., high electric prices did not lower market share nor did low electric service prices increase it.
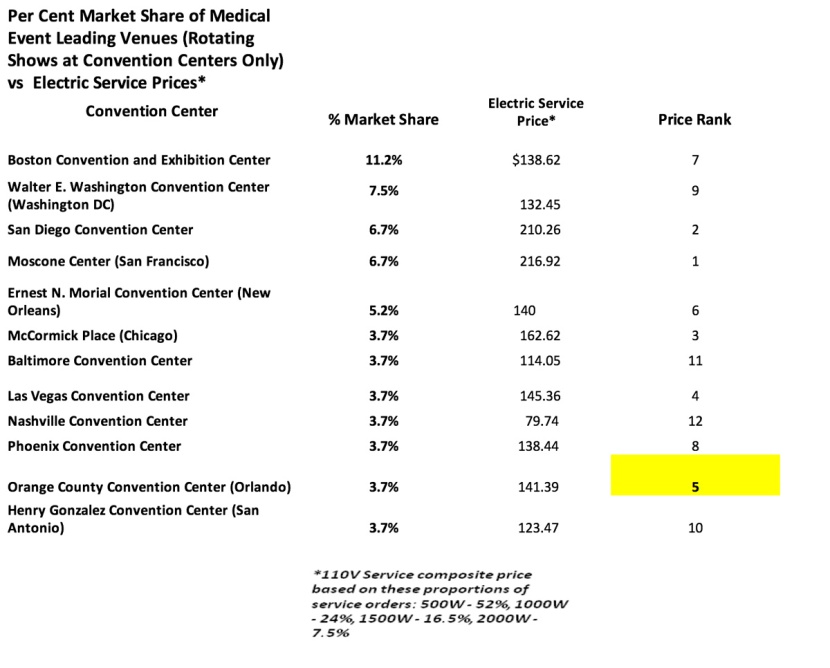
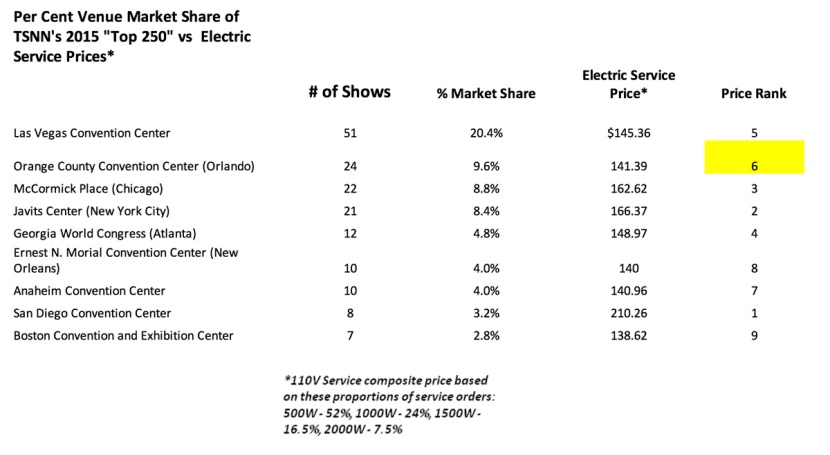
Given the above, what is the pricing power available to the Orange County Convention Center? For Medical events, the center ranks at about the median and below the average of $145.19 by 2.7%. For Top 250 events the center ranks below the average of $155.30 by 10%. A comparison of single phase 208V service prices shows an even greater split between Orange County and the other market share leaders of over 75%. While the proportion of high voltage service for trade shows is low compared to 110V, the span of difference only adds to the pricing power that Orange County possesses.
From Orange County’s annual reports it was learned that revenues derived from electric services are about $11 million annually. The price adjustment of 10% would yield an additional $1.1million and would not pose a business risk. It would have to be rolled out gradually and with some forethought and finesse. For example, would the price increase affect the convention center brand element of affordable pricing? Based on the analysis above, I do not think it would.
- Austin Convention Center – The Austin Convention Center is enjoying a lift in reputation driven by such popular events as South by Southwest (SXSW) which has become a national music and cultural event. It is also a venue in demand for IT sector events and annual meetings for state professional associations. The state association business is a sector that it must compete for against other Texas cities and venues. The analysis below compares electric service prices to other state venues.
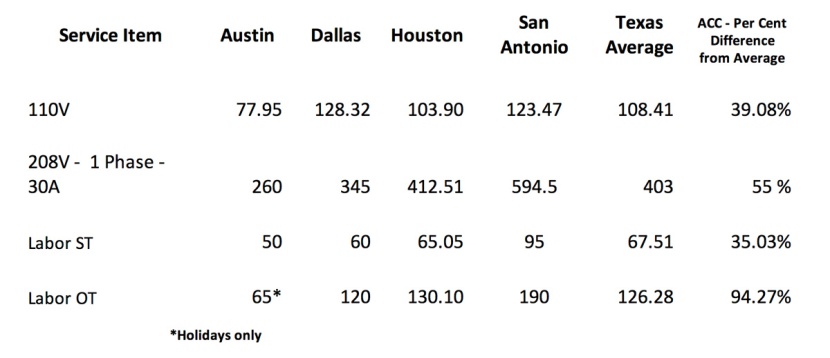
The Austin Convention Center is nearly 40% less than the average price for 110V services (the most ordered services). From the City of Austin’s annual reports it was learned that revenues derived from electric services are about $2.5 million annually. The price adjustment of 10% would yield an additional $250,000 and would not pose a business risk; 20% would yield $500,000.
Both Orange County and Austin are good examples of how a relatively simple analysis can expose some revenue opportunities which don’t require investment and on the surface pose little business risk. Cautious convention center management may need better assurances of how an underpriced revenue situation could be solved using pricing power while not adversely affecting the normal exhibitor service requirements or their intentions to increase service. In this instance I would recommend a survey of exhibitor attitudes be done independently.
Another Method to Use Pricing Power – Make All Exclusive and Self Operation Electric Service Order Forms Access Controlled – There are other methods related to the service pricing and the presentation of the pricing schedule which can be used, especially with a self operation arrangement, to increase revenue. These methods are practiced mostly by the electrical contractors who work in the Open arrangement previously described. There appears to be a real “tradecraft” in their practice. There are many reasons related to security for making all on-line service orders access controlled. Access control also all permits convention centers to make price changes based on the type of event or prior history of the event; certain industry sectors are less price sensitive than others, prior event history may show that certain service or rental items are ordered more than others, certain type of events may have more late or floor orders than others, etc. In all cases the pricing adjustments should go up, not down and most importantly – don’t overreach.
Increasing Profit through Productivity Gains
Structural Changes to Electric Service Work Jurisdiction – There is a silent conflict that exists between two trade groups and their work jurisdictions which impedes the ability to increase productivity and profit for electric services. The conflict is between electricians and carpenters or stage hands (who assemble exhibit booths). In most exhibits there is some placement, dressing or connection of electric cables to devices which are integral to exhibits or attached such as a video screen or exhibitor owned display lighting. The connections referred to are simply devices using a straight stab plug to a power source supplied or an extension cord. Electricians generally win the argument. That means that electricians normally have to re-visit the exhibit booth sometime after the base power is supplied. At this point the aisles are crowded with freight, other tradesmen and exhibitors. It’s time consuming, so the time to fulfill an electric order is increased and productivity declines
Two convention centers have recognized this and wisely changed these rules, the Boston Convention and Exhibition Center and the Orange County Convention Center. In both cases the service order forms state that electricians are not required to be used for electric distribution within the exhibit booth; General Service Contractors or EACs (carpenters) or exhibitors may do that work themselves.
The Javits Center Experience in Boosting Productivity – 1997 to 2008 – By the end of 2000 Javits management reckoned that their electric service pricing power had run out; that increasing service prices may result in a decline in service order growth, exhibitor complaints and possibly recurring shows looking for other venues. Our national competitors had begun to moderate their prices but more disquieting was that some competitors had started to offer heavily discounted rent or no rent in order to gain market share. We had been casually tracking key performance indicators (KPIs) such as labor hours per billable item, electric revenues per net square foot per show and per exhibit hall and order fulfillment percentage per move in day. Now the KPIs had become much more meaningful and we acted on what the KPIs showed. We set productivity goals, labor hours per billable item and electric revenue per net square foot per exhibit hall worked best. We held labor supervision accountable for improvements in labor productivity and surprisingly did not have to make many personnel changes. Productivity climbed. Profit margins climbed concurrently to about 30%. Once the work habits and routines and the necessary levels of productivity were understood and accepted, price increases became modest, keeping us competitive. Labor rates did not have to be applied to service rates because we had confidence in including labor costs in flat rates.
Adding New Products and Services
Here are a few examples of things that have worked:
- Sale of extension cords of differing lengths
- Sale of spare light bulbs. Carry a ready inventory of common retail display lighting
- Rental of high wattage light fixtures with a high color rendition index (above 80). If your center hosts fashion, textile, gift, automobile or art shows, then an investment in this type of lighting may be a worthwhile expenditure. The lighting is normally suspended from overhead lighting truss or catwalks. The price point for rental units is high ($ 325 at the Sands in Las Vegas and $341 at the Javits Center). Sales volume is also very high. At Javits this lighting comprised 8% of total annual electric revenue.
Recommendations
- Is your current business arrangement in your center’s best interests? Consider self operation of electric services. It may be the best method to increase revenues
- Do a cursory comparison of base pricing, labor pricing and time and material pricing of your regional and national competition .Make judgments about your pricing power. If you find opportunities drill down further
- If results are favorable, create a new pricing schedule and simulate a new year using previous years business volume and service order proportions. Review forecasted revenue results.
- Share results with board members. Persuade them to buy in to a change
- Review all your internal procedures; planning, labor assignments, KPI tracking, material control, etc. for the purpose of increasing productivity. Plan on changes and forecast results.
- Revisit pricing schedule and simulation and factor in predicted productivity gains. Review forecasted profit results.
- Make a decision to launch new electric service pricing
- Invest in software to create on line access control for electric forms for each show
- Launch new pricing. Do so gradually and let show managers know. Don’t overreach.
For convention centers interested in improving service revenue and profit, consider the services that MTMConsult, LLC can provide. Our team of experienced practitioners with real field experience will drill down to the important details and provide actionable results.
Email us at advisor@conventioncenternow.com or call – 203-273-6999
The Math and Logic behind Sales Forecasts in Convention Center Expansion Feasibility Studies
In my time at the Javits Center, I was personally involved in three expansion feasibility studies with two different consulting firms. My intention in this piece to explore the sales and marketing forecasts which are considered and are integral to economic impact estimates and ultimately convention center financing and construction.
The acquisition of investment financing, especially at the scale of a convention center expansion, requires a feasibility study prior to launching the project. Traditionally expansion feasibility studies consist of several phases that fall under these categories:
- A review of history of event activity (# of shows by type, by season or month)
- A review of history of occupancy (the whole convention center, by month, by space – exhibit halls, meeting rooms and ballrooms)
- A review of history of attendance (for all events, by event type, by season or month, with out of town attendees broken out)
- Competitive analysis of the same performance statistics above
- Competitive analysis of the size for the whole facility and by exhibit space (incl. # and size of subdivisions), meeting rooms (sizes and #) and ballrooms
- Destination comparisons and rankings for competitive cities such as reputation as an event city (all and certain sectors) and other city attributes such as hotel inventory and brand mix and distance from the center, airport service and passengers per year, etc.
- Forecast of new events if certain actions/investments are taken. Presumably facility re-fit and renovation and/or expansion.
- Estimate project costs
- Estimate new income
- Estimate ROI
- Estimate incremental quantitative economic value/benefits ( event attendee spending, direct and indirect employment) and qualitative benefits
There are some impediments and challenges to accomplishing the above:
- Firstly, few convention centers keep disciplined records of performance indicators that neatly fit a feasibility analysis (occupancies, net square footages, event attendees, profit/loss per event and per event type or profit/loss per net square foot). Occupancy especially is troublesome because some convention centers measure differently from the prescribed method.
- Secondly, many industries are well covered by academic research and scholarly articles citing statistics and making thoughtful rational explanations. For the convention and trade show industry there are few, especially in regards to convention center expansion. Occasionally there is an insightful article in newspapers or business magazines, but not the scientific or rigorous statistical analysis you might expect to see.
- Thirdly, attendee numbers are mostly self reported by the event managers, very few are audited results. Most experienced convention center management teams regard them as probably exaggerated and unreliable. Conversely hotel room nights are reliably reported and most CVBs track these statistics. However, these statistics are many times under reported. For mature shows that consistently have returning attendees each year, there is anecdotal evidence that many book their own hotel accommodations and are not reported in the “room block” (where the hotel room night statistic is derived).
- Lastly, many feasibility studies were strongly influenced by the intensity and drive of local hospitality businesses, all with the enthusiastic support of political leadership. For consultants it is and was difficult to stay objective. That seems to be changing over the last few years.
Where Things Stand Now
Trade and Consumer Shows and Conventions with Exhibits
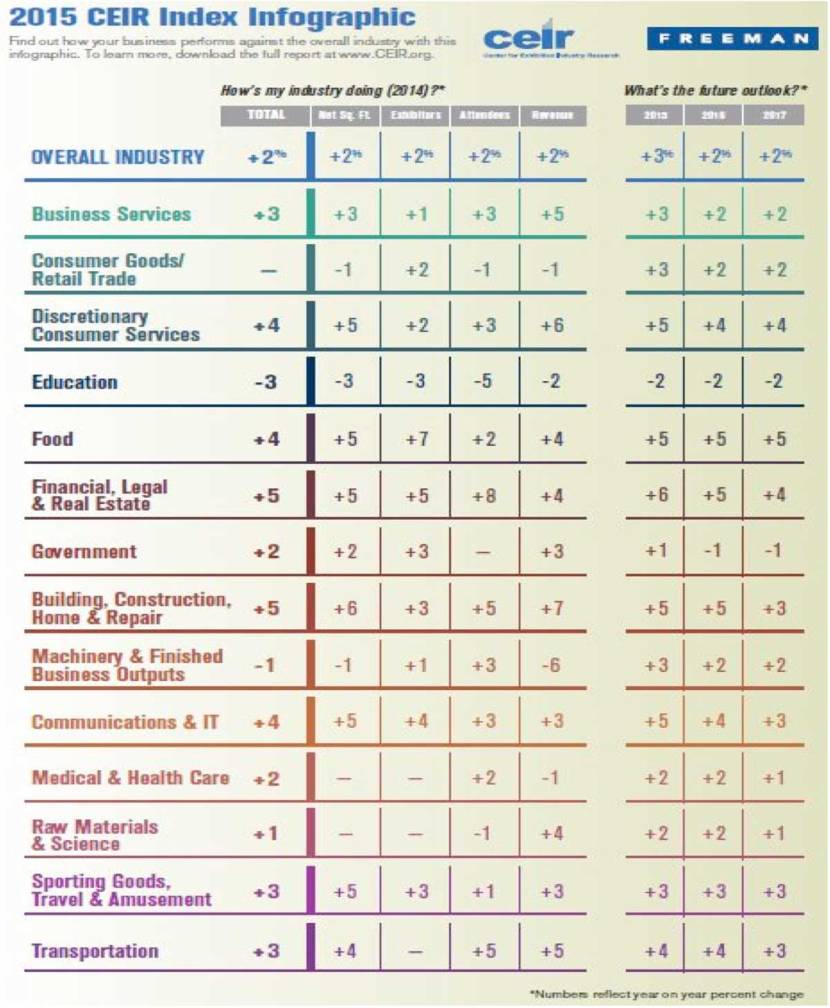
Tradeshow and convention directories list over 5,000 trade and consumer shows and association meetings or annual conventions. Generally not listed are private corporate events like annual sales meetings, IT developer conferences, or product roll outs and demonstrations. The very information rich table shown below is taken from CEIR’s forecast of industry growth from 2014 through 2017. You can download it at https://www.ceir.org/sites/default/files/CEIR%202015%20Index_Infographic_0.pdf. As shown, the growth rate is 3%, which puts the industry back at pre-recession levels. The only industries in decline are education and government services. Note that the statistics measured which make up the CEIR Index are net square feet, attendees and # of exhibitors, some of the same statistics which are important when judging convention center performance.
Convention Centers
For convention centers there is no CEIR to act as a clearinghouse of data collection and analysis… The industry used to rely on Tradeshow Week (TSW) to periodically publish information in directory style about the amount of exhibit space available nationwide and then apply a percentage growth and make a forecast for the next year. TSW ceased publication in 2007 and the easy to follow directory was not available. It is instructive to look at the rate of growth through the years that TSW was published:
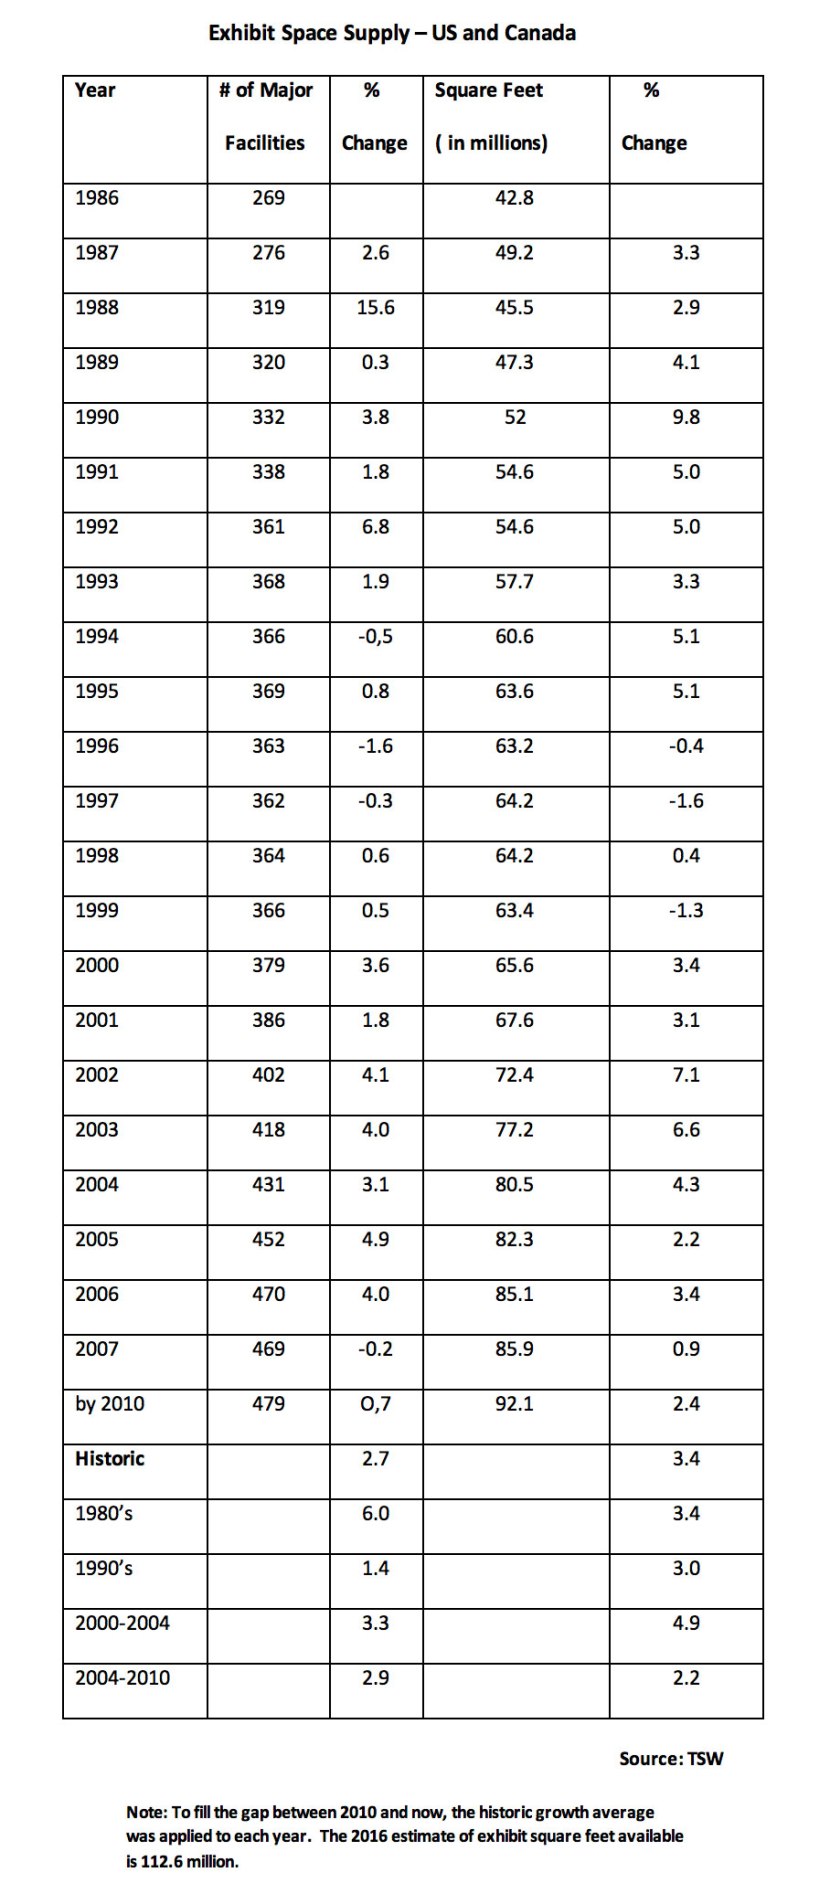
There is no way to statistically tie the scale of total exhibit space and the rate of growth to the scale of shows (expressed in net square footage) and their rate of growth without an extensive research project. Other consultants have tried to make adaptations to the facts they could find supplemented with many assumptions. Their attempts to show the relationship and bring clarity to the subject were noble efforts but they just won’t fit into a feasibility document reviewed by bankers, political leaders and of course the public. If you’re not convinced there’s an oversupply problem which has a material effect on your center’s performance, consider these facts:
- The event industry is growing and only a small fraction of convention centers can consistently boast above 50% occupancy, so there’s lots of vacant space.
- Falling prices is a marker for oversupply. Oversupply is not uncommon. It extends beyond commodities like wheat, corn or oil. It extends to finished goods like LED lighting where prices have fallen 40%. It extends to convention centers too. Convention centers are still deeply discounting or dropping rent charges to keep market share. You might expect that revenues at convention centers would rise in concert to the revenue increases seen and forecasted in shows. They have not. Most are declining.
How Did This Happen? Why Is There Such a Surplus of Convention Center Space?
Most of us felt there was an oversupply problem 10 years ago. Still from 2005 t0 2015 exhibit space increased over 30%. A vocal critic of new and expanded convention centers emerged in the 1990’s, Professor Heywood Sanders (University of Texas-San Antonio). He focused his attention on the obvious – most of the forecasts from feasibility studies did not happen as predicted. In fact they were highly inaccurate. He also focused on the methods in which public officials managed to finance convention center projects. His conclusion was that the events such as the 9/11 attack, while material, would not have stopped the poor performance of expanded convention centers even if the attack had not occurred. His premise was that the studies relied on survey data of expectations (opinions of prospective show managers who were interviewed) and not on actual data. Professional statisticians would agree. They would recognize this common tendency to ignore prior history when making important decisions. Statisticians have given this tendency a name, base rate neglect. Base rate neglect can occur in any field; engineering, science and business. In business, case studies find most managers depend more on new and highly relevant information, favoring it over the base rate Sanders characterized the studies as “faulty analysis, erroneous conclusions”. Professor Sanders had and still has powerful disciples. Business writers from well known publications weighed in. Business writer Victoria Murphy wrote an article in the Forbes February 2005 issue “The Answer Is Always Yes”. In it she took aim at the Oregon Convention Center:
Today, $116 million in bricks, mortar and carpeting later, Portland’s trade hall is struggling. It lost $5.5 million last year on $15.3 million in revenue. Occupancy since the expansion has fallen from 71% to 43%. The Wood Technology Showcase, a Portland event for 34 years and one that expansion boosters cited as needing the enlarged venue, has been postponed because of lagging attendance. The same run-down buildings and third-rate restaurants that always surrounded the center, like Burgerville and a deli that sells sushi and Beanie Babies, are still there.
“We haven’t set our sights on being profitable,” says Oregon Convention Center’s executive director, Jeffrey Blosser. “These are challenging times in our industry.”
Challenging? The business is a mess, plagued by a taxpayer-funded burst of expansion and a continuing dearth of customers. Over the last decade cities’ annual capital spending on centers has doubled to $2.4 billion, according to a study by the Brookings Institution. The projects are frequently backed by expensive feasibility studies from consultants that rarely give a thumbs-down. Forty-four new or expanded halls are in the works, in hot spots such as Las Vegas and not-so-hot spots like Albany, N.Y. Seven million square feet will be built in the next few years, adding to the 64 million square feet now standing.
Unmentioned at ribbon-cutting ceremonies is that the space will be impossible to fill. The biggest 200 shows, a rolling list measured by Tradeshow Week, are using the same amount of space they did in 1992. Attendance has fallen at most centers, even those with new space such as in Indianapolis, Chicago and Atlanta. The thriving destinations, Orlando, Fla. and Las Vegas (which just announced a $400 million expansion), are stealing smaller shows away from other cities, stuffing in several at a time. The smaller trade halls are discounting, even giving space away.
….. By the end of 2004 the center’s finances were in bad shape. To get 34 decent-size shows, the center had to indirectly waive rental fees for the organizers of 10 of them. The building would have lost $15,000 a day if not for $6 million in tax subsidies. Hotels are 60% occupied, as fewer than 30% of convention-goers last year came from outside Portland.
The fix, says center director Blosser, is a new 600-room convention hotel, backed by the city. “We lose a lot of shows because we don’t have a big hotel. But it doesn’t pencil out for a private company; a hotel here would need help,” he says. Blosser commissioned Strategic Advisory Group, an Atlanta consultancy that specializes in convention center and hotel studies, to assess the idea. SAG says the new hotel will bring in annual spending of $116,000 per room.
Maybe Blosser should run those numbers past the folks in St. Louis. In 2003 St. Louis followed a $270 million convention expansion with a 1,081-room, $265 million adjacent hotel, paid for with public and private money. Hospitality Consulting Services projected 800,000 room-nights per year citywide with the addition of the Renaissance hotel. Instead St. Louis is getting only 400,000. A nearby McDonald’s closed shop. The neighborhood remains lackluster, punctuated by a store peddling gold chains and a discount sneaker outlet.
In August Moody’s downgraded the city’s $50 million hotel bonds even deeper into junk. The development group will likely have to drain the $5.7 million left in its reserve fund to service the debt and come up with additional money from stakeholders like Kimberly-Clark. “The assumptions that go into feasibility studies are the problem,” says Anne Van Praagh of Moody’s. “The outside firms have no financial stake in the business.”
There simply was not enough accurate data to clarify and validate demand and what data there was too often interpreted poorly. Professor Sanders believes that the consultants should have known better and expanded their scope to include more historical research. He strongly implies that a group of consultants played the game fast and loose. However as I have experienced, what little they presented was enough for the clients. Clients were more inclined to accept positive interpretations of data and research and readily used it as validation to pursue financing and expanding. There were also many other strategic judgments which had to be made beyond the feasibility studies; competing for tourists and business tourists among cities, creating a means to better distribute the tourism dollar to include seasons which are not traditionally vacation time, bolstering the tourism physical infrastructure, creating steady service industry jobs to working class and immigrant citizens, etc. Enlightened city leadership sees the role of government to invest in those things that are going to support an economic and social strategy for the future. Building the kind of facility that will enable a city to attract and accommodate the kinds of business, academic, professional and investment-related activities that support such a strategy is more of an obligation than an indulgence.
Other Observations, Inferences and Theories
Yes, in hindsight there were some poor decisions made in the 1990’s and early 2000’s regarding expansion. We know that now. However, some extraordinary world and national events took place during this time which seriously impacted the performance of new and expanded convention centers:
- The internet/IT boom and bust cycle – Certainly everyone took notice when COMDEX was sold in 1995 for $800 million. Many, including convention centers in Las Vegas, New York, San Francisco and other cities profited also. The boom cycle lased for about 5 years. New concepts in technology meant new shows. Large horizontal IT events would spawn vertical shows which would often play at smaller venues. When the market bubble burst in 1999/2000 it was a shock to all venues that had relied on technology trade shows. Some consultants advised their convention center clients that the downturn would be short-lived based on the recent short recession in the early 1990’s. Things didn’t turn out that way. Then:
- The 9/11 attack – A general malaise settled over the industry, business travel slowed to a crawl, attendance dropped, shows cancelled and other marketing channels were emerged
- Structural changes in marketing communications – Certainly the rise of on-line advertising, shopping and buying had an affect on trade shows and conventions.
- The on- set of the Great Recession 2008 – The pace, the acceleration of business and banking failures, and the loss of market value hit worldwide. Of course this would affect the convention and tradeshow industry profoundly.
- The expansions that took place in the last 10-15 years were either under construction or were in some way committed to proceed. They faced enormous impediments given the events listed above.
Critics and doomsayers of convention center expansions apparently believe that growth industries should be buttoned up and tidy. They are not; they are disorderly and at times chaotic. They have conservatives influences and risk takers. In a highly competitive industry risk takers usually come out on top. Critics should stop and take a top down long view of the convention center business and consider the normal risk factors and business cycles that can and do occur in nearly all growing business sectors. . The consulting firm HVS, explained it best:
As an established industry, continued growth in demand will come not from latent sources, as occurred during the last few decades. Rather, industry growth will depend on new demand, which is affected by numerous factors such as the cost of travel, the importance of face-to-face interaction in certain industries, improvements in facility design, resources available to promote events, trend in how firms allocate their marketing budgets, and overall growth trends in the national economy. In most industries that go through periods of overbuilding (e.g. hotels, residential, shopping malls, and office space), the ability to generate private return on investment eventually limits the expansion of supply. Since most convention facilities are publicly financed, this market discipline is not necessarily present. Instead limited resources of governments and the public decision making processes that consider the merits of capital investment place limits on supply growth. In our experience, most municipalities are not “willing to try almost any investment in their quest for more convention visitors.” Concern over the proper allocation of limited resources and historical experiences of success and failure play very important roles in the decision making process. Which brings us to a point of agreement with Sanders’ overall conclusions: careful and realistic consideration of the chances of success should inform the public decision making process about investment in convention centers” Concern over the proper allocation of limited resources and historical experiences of success and failure play very important roles in the decision making process.
Expansion project costs are normally quite high but sometimes a good fraction of the financing is not related to expansion of sellable space. Rather, the financing is used to pay for deferred maintenance. Deferred maintenance can be extensive preventive maintenance, corrective maintenance, system upgrades, or repairs that are deferred to a future budget cycle or postponed until funding becomes available. Civic pride, competition among cities for event market share, the city planning practice of creating an anchor or destination spot within cities have caused the construction of massive structures with expensive architectural features and finishes. Many of these building elements and systems are expensive to replace, repair and renovate. They are generally of high quality and durable, reducing the risk of failure. They become easy to defer, repairs are expensive and they can wait. An extreme example is the Javits Center’s recent $453million expansion only saw a very modest increase in exhibit space and virtually none in meeting rooms. Rather, 70% of the funds were used for completing deferred maintenance projects for the roof ( which had legendary leaks since the center was built), the curtain wall and roof glass which had gone beyond its useful life and the HVAC mechanical plant ( 8,000 tons of air conditioning capacity supplied by roof top package units). I believe other convention centers face similar problems. Deferred maintenance costs build and compound year to year, while municipal or public authority budgets typically drop these line items year after year. They don’t go away and eventually expose themselves with building problems which can affect business. How big can they get? As an example, there is a benchmark for US universities on deferred maintenance – about $3.50 per square foot. Apply that to the square footage of your convention center. Convention centers should know before they build how deferred maintenance costs will affect them in the future. Designers should do a life cycle costing of major systems before construction. Often the most reasonable solution is to attach the deferred items in a bond issue to finance expansion.
Recommendations
Our industry is beginning to sober up regarding expansion feasibility studies. From the few I’ve read which were written since 2013, I’ve been most impressed with The Strategic Advisory Group’s Colorado Convention Center Feasibility Study (released in 2014). The presentation is crisp with plausible explanations. The study adheres to the principle of measurement validity, i.e., how well the results of a study measure what they are intended to measure. The measures are relevant and are not lost in statistics which are only material if the study was on a national scale, not just Denver. While surveys of existing and prospective clients were done, the report defers to statistics, principally occupancy and occupancy’s sub-sets. There’s a certain elegance to that. It speaks unvarnished truth and it is all encompassing; all other performance measurements are derived from occupancy. Further it discusses vertical industries and their events which might have a connection to Denver and the Rocky Mountain region. The report examines “city –wides” and effectively explains them in occupancy terms. Lastly it takes the time to discuss the cities brand and tourism attributes and compares them to competitors. The convention center’s venue characteristics are important but the foundation of a favorable brand, a place that people emotionally connect with comes first. For convention centers about to launch a feasibility study read this one first.
If I were a convention center manager about to contract with a consulting firm for an expansion feasibility study, here’s the scope of services I’d ask for when composing the sales and marketing section:
- A narrative including tables and graphs of convention centers’ current position with respect to size and growth and the event industry’s size and growth. If information can be obtained about the #, size and growth of corporate events include that also.
- Obtain the following statistics:
- A history of my center’s occupancy for at least ten years.
- Breakdown the occupancy by month, exhibit hall, meeting room suite and ballroom, and by type event (tradeshow, consumer show, entertainment, banquet, social gathering, corporate meeting, product roll out, film and photo shoots, etc), by industry sector (medical, financial, consumer goods…..)
- A history of the net to gross square footage percentage for exhibit halls
- A history of occupancy for regional and national competitors
- A history of event attendance (note attendance figures that are audited) by type event and by industry sector)
- A comparison of physical plant characteristics with competitors ( size and number of exhibit halls, meeting rooms, ballrooms) , age, configuration (facility map)
- A history of annual revenue and expenses broken down
- A history of revenue earned per square foot (electric/plumbing, telecommunications, cleaning, F&B, etc.) earned annually and by event type and industrial sector
- A history of competitors’ annual revenue and expenses broken down
- A description of hotel inventory – #, rooms, committable rooms, brand mix, distance from center
- A description of restaurants, nightclubs, concert venues in and around the hotels and convention center
- A description of the airport ( # of direct flights to certain cities, annual passengers, etc.)
- A comparison of city brand and reputation with competitors from an economic or social research organization such as Bloomberg Business, the Miliken Institute, The Reputation Institute, and others. Develop a composite rating
- Describe the verticals that occupy the center and include verticals that have events at other city venues. Characterize whether the verticals are or are not a reliable prospect.
- Closely examine the Lost Business reports for the past 5 years. If you consider them unreliable then insist that they be re-visited. Differentiate between turn-aways because of lack of space and /or time of year or days of week and lack of certain services, from service quality, from pricing issues and from destination issues ( such as the quality of hotels, the city crime rate, the city’s overall reputation, etc.
- Develop a list of new prospects and assign priorities based on probabilities of a booking. Do not simply make generalizations about the size and growth of the market and through a judgment call contrive a number of new events
- Construct an Occupancy Model for 3 years forward. Put it in a calendar form and footnote each event with a probability.
I would consider the above phase 1. of the study. There is no need to go further with an economic impact evaluation if the above is unfavorable.
Perhaps you just received a feasibility study for a sizable expansion. Need a second opinion from a team that’s been there and done that? We can conduct a peer review of your feasibility study and point out strengths and weaknesses. These decisions are matters of trust. Consider MTMConsult, LLC .
Email us at advisor@conventioncenternow.com or call – 203-273-6999
Consumer Shows – A Fresh View at an Old Topic
Most US cities have elected to have the CVB organization control the long term event bookings at municipal or state owned convention centers. The CVBs dutifully pursue events which naturally bring in the most out of town visitors. In doing so they “hold” time and space for the best prospects and discourage active pursuit of less desirable ones. Convention center sales teams are generally free to pursue events that don’t require long term reservations of dates and space. In this model however, little long term security on space and dates can be offered to events that cannot demonstrate high numbers of out of town attendees. Trade shows which may fall into this category and regard your city as a strong market draw will look for alternatives. It is likewise for consumer shows, which simply won’t rotate to your city or will choose a less prominent venue. Know that trade and consumer shows normally count on for four things before making venue commitments; date reliability, space reliability, financial predictability and theme protection.
The Javits Center Experience with Consumer Shows
I believe the Javits experience from 1995 to 2008 is instructive and relevant to other cities with CVBs and large convention center management teams. In my time at the Javits Center the sales and marketing arrangement was not as described above. Javits controlled its own bookings. Our board policy and directive was and probably still is to create a sales model that hosted events which brought in out of town attendees. However, there were understood conditions to this directive which, while not formally disclosed and publicized, were fundamental business tenets:
- The Javits Center received no subsidy to help pay annual expenses. Revenues had to meet or exceed expenses and we always achieved that goal. Javits management and Board of Directors never acknowledged or endorsed the now fashionable concept that convention centers are not designed and built to make money.
- Management recognized that high occupancy was key to building revenue base and understood that it was near impossible to achieve 50% occupancy without having annual recurring events. Consumer shows represented about 10% of Javits occupancy annually. Javits occupancy from 1997 through 2008 always exceeded 65%. In 3 of those years Javits exceeded 70%.
- The Javits sales and marketing approach viewed certain economic sectors as natural fits for the city. These events were recurring and would pay the license fees and expensive labor and service costs because it was in their best interests to stage their event in New York City. The NYC/CVB would argue that booking a large professional association meeting may bring 10,000 hotel room nights whereas a fashion, luxury goods or pharmaceutical trade show would only yield half of that.
- Javits had a different point of view than the above. Javits regarded the recurring shows (trade, association conventions and consumer shows alike) as annuities, something we could count on for a consistent measure of hotel room nights and revenue. Javits management lacked confidence that different large association bookings could be repeated year to year and we had certainty we were correct. The probabilities were simply too low. Also, the association RFPs which we did collaborate on with the CVB were all based on price. After 9/11 many of the license fees of competitors were often negotiated down to zero and many still are. It was in Javits best interest not to compete on that basis. For associations which had a genuine interest in New York City, especially during months of soft demand or where retained clients had flexibility, both NYC/CVB and Javits management usually worked out a suitable deal without an RFP process.
- The relationship between the NYC/CVB and Javits was always cordial and professional despite differences of opinion. Occasionally certain dialog would raise tensions and it normally occurred surrounding the NY International Automobile Show, the largest consumer show at Javits. Public officials or hotel management would publically suggest that NYC/CVB control of long term bookings would be a better method of conducting business and bring in more out of town visitors. They’d naturally point to the Auto Show which took 17 days out of the event schedule during a prime convention month. For Javits the Auto Show represented 4-5% of annual occupancy and 12-17% of annual revenue – the thing spoke for itself.
For years it was my belief that CVBs marketing and sales efforts were more aspirational than realistic. I believe now that the Great Recession has had a real sobering effect on convention center management and CVBs alike; there is not enough demand for professional meetings and tradeshows to fill the growing exhibit and meeting space supply and, rising operating deficits and subsidies are coming under greater scrutiny by board members, politicians and the media. These matters and other trends have caused more interest in consumer shows.
A Look at 2nd and 3rd Tier Cities and Convention/Exposition Centers
Any professional tension between CVBs and convention center sales teams all but disappears in second and third tier cities, where the annual event schedule is heavily populated with consumer shows. Indeed in the sample we took some convention centers had more than 50% of their major events as consumer shows. These events are relatively easy to setup and move out, ideal business for weekends. Regrettably the preferred week day business of professional association meetings, business conferences and trade shows are hard to obtain in the face of so much competition. Consumer shows therefore have become the core business by circumstance rather than design. They are material contributors to occupancy rather than occasional ”filler” business – an extra source of revenue. Below are the types of consumer shows and monthly distribution for 2nd and 5rd tier cities from our sample:
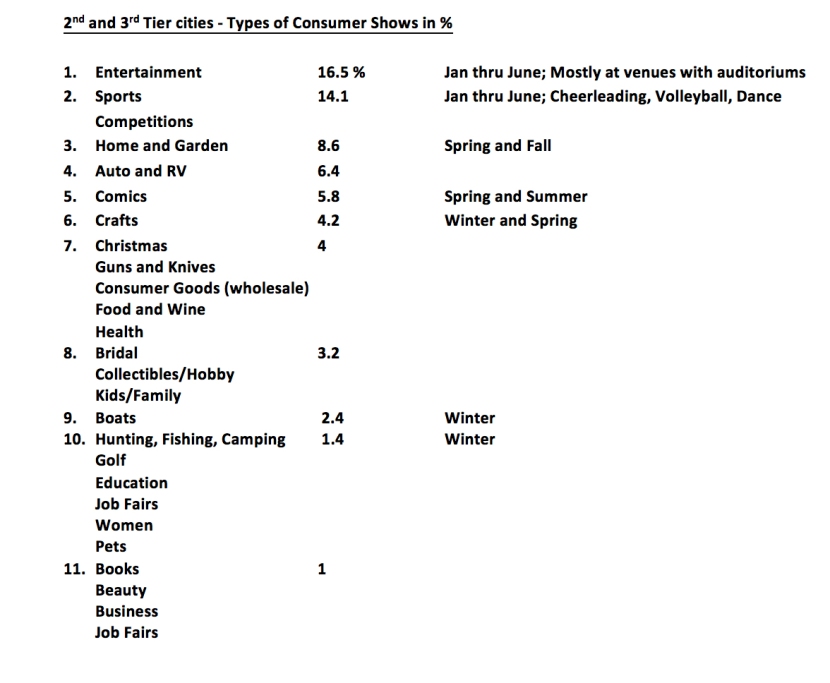
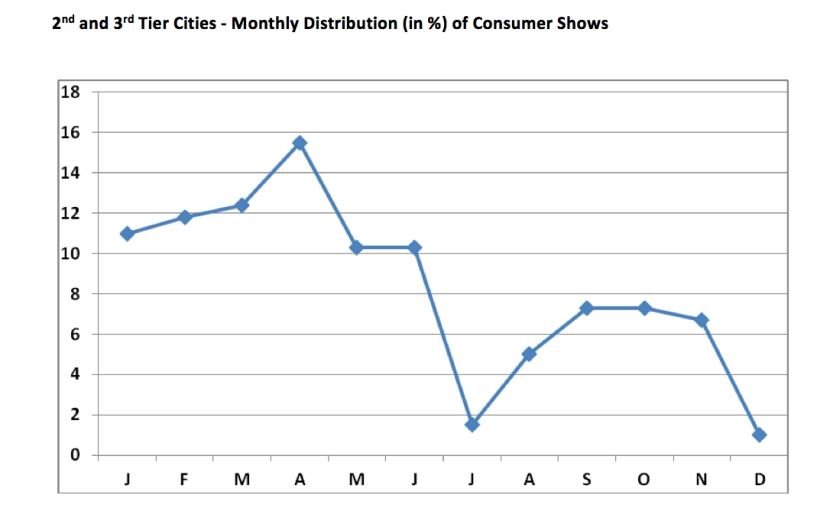
For smaller cities, many of the consumer shows are owned and run by small operators. The events tend to be highly programmed and formulaic and for some events there is a tendency for the event to become stale. Some consumer show managers have recognized this and now include celebrity appearances and expert demonstrations as part of their event program; Home and Garden events have celebrities from HGTV and Food & Wine events have celebrities from The Food Network doing live cooking demonstrations. There are these and other notable exceptions where a consumer event can attain a stature capable of attracting out of town attendees and achieving an impressive level of popularity. Six years ago these shows were described by Tradeshow Week writer Lisa Plummer as “passion events”. In the article she explained, “Representing various segments of the hobby and interest marketplace, these events boast enthusiastic fans so devoted to their pastimes they’re willing to spend discretionary income, no matter how limited, to attend.” Clearly these events don’t just happen. They are the product of well funded, creative show organizers who know the right formula to draw exhibitors and attendees. They typically follow an important rule of thumb; the more focused the event and the more committed the consumer, then the more resilient and successful the event. Their interest is more easily maintained than attendees at broad-based events, which, by contrast, can suffer sharply during an economic slowdown. The two examples are below are illustrative of this type of consumer shows taking place in smaller market areas:
- The Iowa Deer Classic – Held each year in Des Moines at the HyVee Hall & Vets Auditorium, it’s characterized as a “deer hunter’s heaven”. The 25 year old exposition brings in around 300 exhibitors – some of them are from places remote from Iowa; Africa, New Zealand, Canada and all over the US. Products from all over the world accompany the exhibits too. It’s the ideal event to popularize new brands. More than 25,000 enthusiasts attend from Iowa and all the neighboring states. The event has contests, demonstrations and educational sessions by well known experts and live entertainment. Ticket prices are very reasonable. The owner’s passion (Iowa Show Productions, Inc.) is well directed and evident in the success of the event. Des Moines has a population of just over 200,000.
- America’s Largest Antique & Collectible Shows – The owners, Palmer/Wirfs & Associates, hold six events each year in Portland OR (pop. 620,000), Puyallup (pop.39,000; nearby Tacoma pop. 200,000) and Clark County WA (pop. 450,000). Recognizing that antique collecting has is an expensive pursuit, the events are designed so that, as owner Chris Palmer explains, “Attendees can arrive with limited dollars and leave with treasures. There’s a direct connection between what you see on the show floor and most people’s lives,…. people recognize things as being part of their childhood or their grandmother’s childhood. If a hobby is a valued part of one’s lifestyle, most people will prioritize their spending to pursue that passion, and likewise, attend an event that celebrates that interest.” Their two largest shows have over 1,000 exhibit booths and draw 16,000 attendees each. The owner’s were insightful enough to recognize a consumer niche and exploited it.
A Look at Top Tier Cities and Convention Centers
In my mind the one consumer show that stands out as the winning model for its size, attendance, public support, cultural value and fun and amusement is The Paris International Agricultural Show (Salon International de l’Agriculture). The show is 9 days long and the last show had 691,038 visitors and 1,050 exhibitors. Each year it’s held at the Paris Expo Porte de Versailles starting at the end of February extending into March, just as Spring is about to arrive. The show is part festival, exhibition, consumer market and cultural celebration, and no doubt quite profitable for the event owners and managers and the Paris Expo.
There are some US consumer shows which are comparable and have worldwide stature too:
- North American International Automobile Show – Cobo Hall – Detroit – 815,575 attendees
- Miami International Boat Show – Miami Marine Stadium Park & Basin – 96,000 attendees
- The Philadelphia Flower Show – Pennsylvania Convention Center –Philadelphia – 250,000 attendees
- Art Basel – Miami Beach Convention Center – 70,000 attendees
And relatively new:
- Gen Con – Indiana Convention Center – 197,695 attendees
- Comic Con International –San Diego Convention Center – 130,000+ attendees
- New York Comic Con – Javits Center – 167,000 attendees
Consumer show operators could only obtain these attendee numbers in cities with population exceeding 1 million. They also take into account the number of potential attendees within a 3 or 4 hour drive time. Success for these events is also measured in terms of out of town attendees who stay at hotels. The 2015 Comic Con International Show had 59,228 hotel room nights and an overall economic impact of $135, 900,000 to the city. This makes consumer shows with the size and stature of those in the list above competitive with major association meetings. Important to note also is that the consumer shows are normally recurring in the same city and venue.
The percentage of consumer shows to total major events at large convention center in top tier cities is between 15- 20%.
Beyond Passion Events – The Emergence and Power of the “Cons” and Pop Culture Shows
No doubt some of you read the Wall Street Journal article “The Rise of the Cons” March 3rd 2016 by Ellen Gamerman. If not, it’s worth reading. An excerpt from her article appears below:
The industry of the ‘con’—short for convention—offers what the Internet does not: face-to-face experiences, custom swag, exclusive sneak peeks and the bragging rights that come with traveling to the spinning center of a pop-culture universe for one intense weekend. The con business also is fueled by what the Internet does best, as organizers use social media to draw crowds and mine data to predict what audiences will want next.
The beating heart of the empire is the comic con, which has morphed steadily from scattered niche events for comic-book lovers to broad pop-culture fests embracing every entertainment genre. In an effort to capitalize on recent growth, international event-planning firms have been buying up mom-and-pop cons, starting new events and diving into unexplored markets. ShowClix, a platform for live-event organizers, tallied 519 major pop-culture fan gatherings in the U.S. last year, up from 469 in 2014. The 50 new events entering the marketplace in 2015 are more than double the number of debuts in 2009.
In 2006, Comic Con was already a hit in San Diego when Reed Expositions approached the Javits Center about obtaining dates and space for a comic book event. October dates were valuable to us so the prospect of a Comic Book show held only a passing interest. Greg Topalian who was with Reed at the time was persuasive and I elected to fly in to San Diego for a look. And that’s all it took was a look and a quick walk through. Javits booked NY Comic Con. The quirky off-beat show that worked well in San Diego would certainly prosper in New York. The event has been at the Javits Center since and grown each year, now 167,000 attendees. For the Javits Center and no doubt any other large convention centers hosting a major Comic Con type event, the revenue opportunities are substantial. The show floor is populated with exhibitors such as major movie studios, television networks, recognizable publishing companies, automobile manufacturers, and software and telecommunications companies. Many have island booths and all build sophisticated exhibits with high value electric and telecommunications services. Add to that, F&B concessions and restaurant revenue and you have a top revenue producing event.
Despite the success of these shows, some experts see an over- heated followed by burn-out market coming with the Comic Con and Anime brands over saturated. If the Showclix event directory is correct, the trend points towards over 600 such events by 2017. Naturally some experts point out that serious fans already call the shows too generic, commercialized and overcrowded. The business writer Rob Salkowitz predicted that, “If the hard-core fans go, so will the exhibitors who cater to them,” he said. “Then what’s left? Cons just become another consumer event.”
The “Cons” phenomenon is not exclusively tied to comic books. The Wall Street Journal article discussed cat shows or cons, beer cons, fitness cons, quilt cons and others. Cons represents is a differentiating experience in a public setting; an opportunity for hobbyists and enthusiasts to gather and interact in a unique quirky environment which above all is fun. The creators of these events have not stumbled upon the latent demand for these shows just by intuition. There is a science behind it. The leading corporate event company Jack Morton Worldwide produced a whitepaper in 2015 entitled “What people will want from brands in 2015”. The paper is based in part on what neuroscientists and cognitive psychologists describe when an event attendee’s full range of senses are stimulated – the more memorable the meeting experience will be for them, because more parts of their brains are activated. Creators of Cons well recognize that attendees don’t just want to look or hear; they want to interact and stimulate their senses of touch, smell and taste when they visit a destination. The good Cons fulfill that need.
Another Con worthy of mention is Gen Con. In 1967 Gen Con began as a competition of war game enthusiasts in Lake Geneva, Wisconsin. The event derived from its location, the name Gen Con is a shortened version of the original name “Geneva Convention”. Gen Con’s roots grew from historical war gaming popular in the 1960s. Over time it expanded to support all categories of hobby games and family entertainment. Game categories include traditional and collectible card games, board games, role-playing games, live action role-playing games, miniature war games, computer and electronic games, and hybrid games. The show is geared to an “all age” format; and with so many individual events, the show caters to youth as well as those young at heart. In 2003, Gen Con moved the U.S. event to Indianapolis, Indiana. The relocation was a resounding success. Below is a graph showing Gen Cons annual attendance history. In 2015 attendance was 197,695; this is explosive growth. The graph is instructive because it depicts the power of Cons and what can be achieved. I can imagine a graph of similar nature for San Diego and New York’s Comic Con.
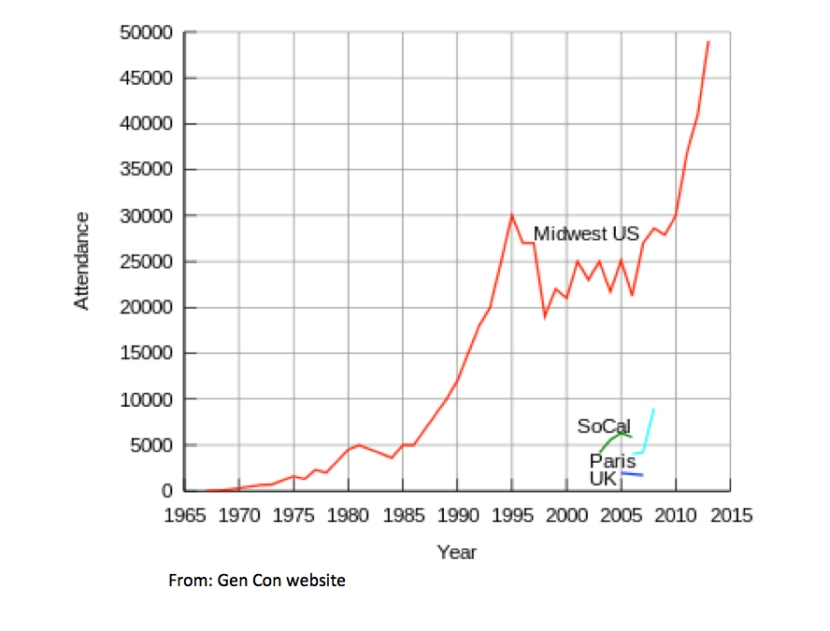
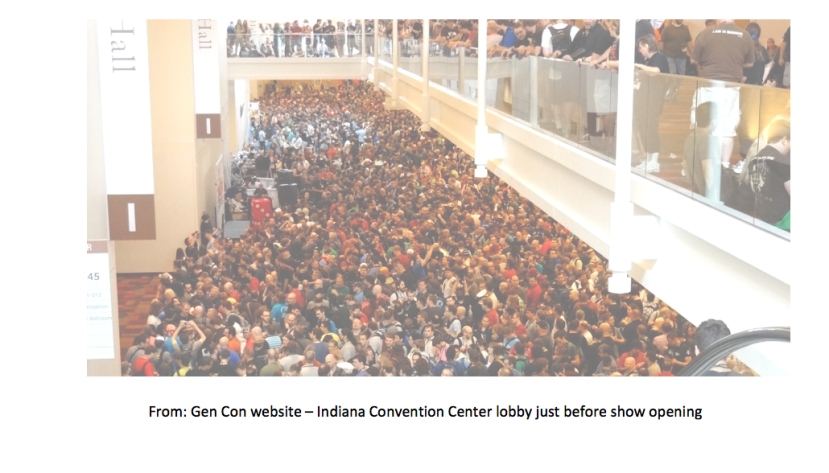
Q. E. D. – A Review of Consumer Show Value
- Consumer shows contribute to convention center occupancy and revenue in a material way and, because they recur year to year, do so consistently. For 2nd and 3rd tier city convention centers consumer shows are essential for financial health.
- Consumer Shows improve weekend occupancy which is historically low in most large urban convention centers
- Although there is security sticking with consumer shows that keep with the enduring themes such as cars, home and garden, crafts, collectibles/hobbies, etc., some creative show managers have taken these themes and provided more edgy focused programming, concentrating more on the consumer demographic and consumer desires. They have stepped things up a notch or two and have demonstrated that the reliable show themes do not have to be so ordinary. Researching properly and finding the better show managers who produce consumer events that have the passion element to them will produce a higher quality event. These exceptions are known to achieve a stature capable of producing more revenue, attracting out of town attendees and attaining an impressive level of popularity among local residents.
- There is another genre of events which has acquired the label of “Cons”. Their ability to attract huge attendance consistently while also exceeding event revenue and out of town visitor goals is noteworthy and remarkable. Creators of these events find hip or cutting edge trends and artfully exploit social media. They seek out venues in cities and regions which have the right mix of population density and a demographic quality which Greg Topalian, President of Left Field Media, described as a level of “geekiness”. Others have called the phenomenon “niche fandom”. For these “Cons” the attendance numbers and the rate of growth for these shows has not diminished.
Recommendations
- For convention center management and sales teams where the CVB controls long term bookings and as a matter of policy avoids and discourages consumer shows – take the time and re-educate the CVB on the changing nature and value of consumer shows
- Don’t just settle for the consumer show line up you have. Research the current show themes that now play at your convention centers and see what others are doing. Creative things are happening to old themes.
- Once a good prospect appears, insist on some date flexibility before closing. You don’t want to turn away association and convention business nor lose a consumer show because of fixed dates.
- Don’t get too cozy with consumer show managers and be mindful if others (board members, politicians, etc.) are. The NY Boat Show issue which occurred in 2013 is a good lesson learned. Fortunately that issue was settled with a reasonable compromise but not without controversy
- Study and stay abreast of what’s happening in the “Con” world. Talk with them, they are very approachable.
Learn More About How Statistics Can Shape Your Marketing Plans
Download our two White Papers (now offered at no charge):
In the Pursuit of National Medical/Health Science Events – A Primer Focused on Convention Centers
Sales and Marketing – Making Sense of Vertical Markets
The phrase “vertical markets” has a different meaning depending on what segment of the trade show and convention industry you’re talking about. Trade show organizers regard a vertical market from a purely commercial point of view. For them, vertical shows promote a single industry category to a specific clientele. By contrast, a horizontal show has many product categories with broad market appeal. For example, Cebit, the huge technology event staged annually in Hannover, Germany, is a horizontal event. CeBit showcases a wide range of innovations and products from many vendors. The attendee base is from many industries. Compare Cebit with another IT event, the Healthcare Info & Mgmt Systems Society Conference and Exhibition held in Chicago this year. This vertical event is held specifically for the medical healthcare sector and the difference is evident.
For convention center and CVB sales and marketing teams, the meaning of vertical markets is very different. Here the meaning is broad and can refer to any event in a particular industrial sector. The phrase “verticals” is often used in marketing plans and intra-industry conferences among convention center and CVB managers. Quite often you will see staffing responsibilities defined with “vertical” sales and marketing assignments; medical, financial, manufacturing, agricultural, religious, etc.
How are vertical markets selected?
- The Case of Professional Associations – For cities pursuing professional association events, the destination appeal, the hotel and meeting room package and the overall cost to association members governs location decisions. Cities and convention centers should know their destination attributes, have a good sense of price point tolerances and overall be able to choose verticals which fit. Large leading convention cities which attract a wide range of association convention and conference business will naturally choose the most reliable and profitable verticals to target. For second and third tier cities the targeting of certain verticals has to be more measured and reflective.
- The Case of Trade Associations and Privately Owned Trade Shows – For these events, location choice is governed by the marketplace where buyers and sellers will reliably gather. Choosing which verticals to pursue is based on straight logical business reasons; the industry represents a leading employment base in the region, there is emerging industry growth giving the region leadership status and enumerated by the number of start-up companies, new patents, amounts of venture capital investment, etc. It could also be that the event’s industrial sector fits your city’s traditional brand – San Jose is “Silicon Valley”, Nashville is “Music City “ , Chicago is “Tool Maker, City of Big Shoulders”. These are all good reasons to dedicate sales and marketing resources to certain vertical markets.
We considered all this and believe the selection process for verticals falls short. What is missing is quantitative analysis of actual market behavior over time. Our belief is that the effective use of statistics and thus chances of success (probabilities) complements and improves marketing judgment. Well informed professional judgment can contribute insightful, nuanced interpretations of data and add market intelligence that cannot be enumerated. Over time quantifying things will become a basis for reliable business forecasting and provide a true rationale for pursuing verticals. It also creates a clear vision of market impediments and opportunities.
We took an in-depth look at two verticals; medical/health science and religion. Both are popular verticals; medical/health science due to its growth, reliability and spending behavior and religion because their events normally occur in summer. Our approach was to obtain as much information as possible by reviewing event directories, news articles about the same subject markets and visiting individual event websites. Our method was to select a sample of events (we chose large national events) and obtain a history of event locations. Our hope was to obtain 10 years for each event, our average was 6 years. We fit the events into eight (8) regions which were selected based on geography as well as economic and cultural similarities:
- Hawaii – On Oahu – Honolulu, and other islands – Maui, Kauai and Hawaii
- Pacific Northwest – Alaska, In Canada – Vancouver, Washington, Oregon and Idaho
- California
- Southwest – Arizona, New Mexico, Nevada and Texas
- Rocky Mountains – Utah, Colorado, Wyoming and Montana
- Midwest/Plains – North and South Dakota, Iowa, Missouri, Oklahoma, Nebraska, Kansas, Minnesota, Wisconsin, Michigan, Illinois, Indiana, Ohio
- Northeast – In Canada – Toronto and Montreal, Maine, New Hampshire, Vermont, New York, Massachusetts, Rhode Island, Connecticut, New Jersey, Pennsylvania, Delaware, Maryland, District of Columbia
- Southeast – West Virginia, Virginia, Kentucky, Arkansas, Louisiana, Mississippi, Alabama, Tennessee, North and South Carolina, Georgia, Florida, Puerto Rico
Our main objective was to record shows with fixed locations and examine and record shows that changed locations each year. For rotating events we picked out predictable patterns as they rotated regions and cities within regions. We also determined probabilities of success for individual cities. The analysis also permitted us to draw conclusions, to explore the fundamental reasons for location decisions and to offer suggestions for convention center and CVB sales teams. We feel we achieved a true and unique understanding of these event markets. The tables below show the results for leading cities:
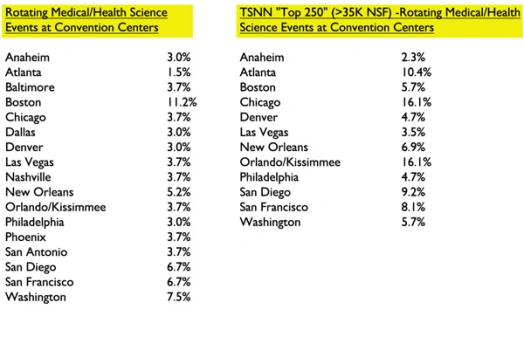
The statistics above show a more open ability to for cities to compete for these events if a larger sample of rotating national events is used. When only surveying large and presumably more important medical/health science events the findings show the events more likely to choose higher rated cities. Interestingly, Chicago’s percentage climbs to 19.2% if all TSNN Top 250 shows are included (RSNA, ASCO and Chicago Dental among them).
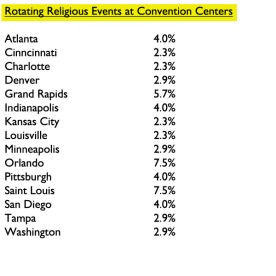
For religious events there is clearly a preference for cities in the Midwest and Southeast. Also notable is that second and third tier cities have relatively high probabilities of booking success.
Convention center and CVB sales teams need to take time to create a statistical description of each vertical shaped and informed by professional judgment as a likely market. Obtain as much history as possible, look for predicable patterns and calculate chances of success. Find out why events choose certain regions, cities and venues over others. Compare one vertical to others and determine which is worth pursuing based on probabilities. The purpose for defining these verticals and obtaining predictable patterns and probabilities is to organize your marketing/sales program to concentrate on the most likely prospects.
Click the link below and learn more about the medical/health and religious event markets by purchasing and downloading our white papers – “In the Pursuit of National Medical/Health Science Events – A Primer Focused on Convention Centers” and “Booking National Religious Events – A Primer for Convention Centers on How Event Location Decisions Are Made” http://www.conventioncenternow.com/white-papers
Keeping Track of Business – All About Occupancy
For convention centers there is certain elegance in using occupancy as a key performance indicator (KPI). One indicator can reveal all – you’re busy, you’re prosperous and perhaps profitable, your operation provides a steady employment base, and your business draws a lot of out-of town visitors to city hotels, restaurants and entertainment venues – or not. High occupancy draws praise, increases revenue, supports further investment, and permits a level of selectivity when booking events. Low occupancy draws scrutiny, often unfavorable, which questions the wisdom of the investment in the first place, and the reaction from convention center management and advocates is generally uneasy and strained. However, occupancy as a performance indicator is unavoidable. As operators you should focus on it and understand how to react and use it. Occupancy is not complicated. Using the method that hotels use as a model is a simple and legitimate way to follow. The performance indicators used by hotels is based on the “Uniform System of Accounts for the Lodging Industry”. These standards are tried and true and accepted by the hotel industry:
For hotels, occupancy is the percentage of available rooms that were sold during a specific time period.
- Supply (Rooms Available) – the number of rooms in a hotel multiplied by the days in the month
- Demand (Rooms Sold) – number of rooms sold by a hotel, does not include comp rooms or “no-shows”
Occupancy is calculated by dividing the demand (number of rooms sold) by the supply (number of rooms available). Therefore – Occupancy = Demand / Supply. Reporting periods for hotels are generally by month and quarter both, with a cumulative average calculated annually. Note that occupancy is not applied to other parts of the hotel such as meeting rooms. The core business of the hotel is to sell sleeping rooms, so the occupancy measure relates to only core performance.
Measuring occupancy should be very similar for convention centers. In this instance because meeting rooms are sometimes viewed differently than exhibit halls, all rentable space (meeting rooms, ballrooms and exhibit halls) should be expressed in square feet.
- Supply (Space Available) – The amount of square feet available (sum of meeting room, ballroom and exhibit hall square footage) over a given time period
- Demand (Space Rented/Licensed) – The amount of square feet rented/licensed (sum of meeting room, ballroom and exhibit hall square footage) over the same time period
Occupancy is calculated by dividing the demand (amount of square footage rented/licensed) by the supply (amount of square footage available). Therefore – Occupancy = Demand / Supply. As an example, say your convention center rented 150,000 sq. ft. for 17 days in September. Your center has 300,000 sq. ft. available to rent each day, then:
Occupancy (September) = (150,000 sq. ft. x 17 days)/ (300,000 sq. ft. x 30 days)
Occupancy = 2,550,000/9,000,000 = 28.4%
Curiously, in my time as a consultant I have run across more than one convention center using a different method which is absurd and just plain wrong. In those cases any occupancy, no matter how small, is regarded as 100% for the time period. Now that’s more than a fisherman’s lie, a great deal more.
Occupancy Nuances
Occupancy is always questioned when serious capital investments, like center expansion, are considered. If board members don’t question it, bankers surely will. There are always distinctions, implications, and complexities when measuring something so important. Know what they are and be prepared to explain things rationally. It’s best to have other performance indicators as support.
- Event Move – In and Move – Out Days – Regard these days as occupied days. Here is where you could say that one center’s occupancy figure for an event does not equal another’s. If your occupancy level is traditionally low, you will often permit many more move-in and out days than a center with high occupancy. You may even comp or discount the rent for those extra days. Contrast this to a very busy center where aggressive date/time management means attaining a few more events. Hence, the number of move – in and move – out days is actively negotiated. The difference between the two convention centers may be inconsequential but it is a worthwhile distinction to understand.
- What About a History of Low Nets? Doesn’t that De-value the Value of Using Occupancy as a Key Performance Indicator? – Yes it could. In my time at the Javits Center we always measured show net to gross square footage (expressed as per cent) for exhibit halls. Our purpose was to monitor net square footage performance. A low net to gross ratio was often cause for a discussion with show managers whose event may be declining. The Javits Center had many recurring events and still does. If we saw an event consistently fall below a certain net/gross percentage, after a time we’d move the event to less desirable space in favor of a show that was growing or a new show. Our advice is to measure net/gross % in parallel with occupancy.
- What About the Quality of the Events? Where Does Occupancy Fit In? – Occupancy is agnostic to the quality of events. Agreed, there are some low quality events, like electronic wholesalers or flea market type consumer events. Let the quality issues come out in the other performance indicators such as service revenue per net square foot or the number of hotel room nights generated.
- What About Events that Are Licensed Outside of Rentable Space? – The example set by the hotel industry applies. They only measure sleeping rooms in their equation. Sleeping room sales is their core business and a simple and pure occupancy figure avoids distortion and equivocating. Rental of meeting rooms or ballrooms is not in a hotel’s occupancy rate. But consider that most other hotel income, meeting room rental, F&B, parking etc., derive from sleeping room sales. Some convention centers conduct business outside normal rentable space (meeting room, ballrooms and exhibit halls). The LA Convention Center and the Javits Center enjoy revenues from film and photo shoots. The price basis for this business is normally a location fee, unless they are using meeting rooms or an exhibit hall. That’s not the usual way film and photo shoots operate however. They favor public spaces and tend to be free ranging, making on-site changes and often using a variety of corridors, outside space, even the roof. It’s tempting to include all the free ranging space used and include it in occupancy calculations. Our advice is stay pure, keep this square footage used out of occupancy calculations unless they operate in a fixed rentable space.
Parsing Occupancy
Now that you understand occupancy, use it as a statistical foundation for other key performance indicators:
- Compare occupancy by exhibit hall by month – Use it as a basis for setting rental prices. Demand pricing is used in many other business sectors, most commonly airline travel and hotels. You can simulate past years occupancy to see how revenues can change with a demand pricing model. The objective of course is to increase rental revenue and create price incentives for events to consider off months and less popular halls. To our knowledge no convention centers use demand pricing as a consistent formal pricing method.
- Calculate monthly and annual revenue and expense per Occupied Day – Use this as a basis for forecasting based on predicted occupancy.
- Calculate monthly and annual energy use and cost per Occupied Day – Use this as a basis for forecasting energy costs, one of your largest line expenses. Graph same and you may be surprised what you find. Our good guess is the result will be non – linear.
Seventy Percent (70%) – Why is it Maximum Practical Occupancy?
More than 20 years ago the firm PWC proclaimed 70% to be the maximum practical occupancy for convention centers. Their logic was that convention and trade shows have definite dates and days of the week in mind and typically don’t compromise. Naturally there are gaps of several days or more between these events. Add holiday times of year such as Christmas when any trade show or convention is rare. Now the event day possibilities lessen, making 70% ring true. Having experienced over 70% occupancy, there are other factors to support PWC’s theory:
- Building and plant maintenance becomes quite difficult. Deferred maintenance lists grow rapidly. Odds increase for a utility infrastructure failure – power outages, air conditioning failures
- Labor and staff end up working long hours. Sometimes inexperienced part time workers have to be hired, leading to service complaints. Vacations and time off become difficult to schedule
- General Decorating contractors, already working with thin profit margins, see profits shrink as they may have to fly in extra management and supervision from other cities. Labor over-time prices are unavoidable, except in cities with “1st eight straight” work rules.
Facility Management – Energy Management – Choosing a Replacement Lighting for High Bay Fixtures in Exhibit Halls – LED vs Induction Lighting
For high bay lighting applications in exhibit halls, most of you have already made the transition from mercury vapor to metal halide. Now many of you are no doubt thinking about the next transition. Lighting technology is improving at a very rapid pace and each technology transition provides material improvements in lighting efficiency (lumens/watt), lumen depreciation, lamp life, energy costs and maintenance costs. Two lighting technologies have demonstrated clear advantages over metal halide; induction lighting (IL) and light emitting diode lighting (LED).
IL lamps are a specialized type of fluorescent lamps that do not have direct electrical pin contacts but rather use an electromagnetic coil which provides a more gentle start making the lamp life much longer. Their commercial application is growing steadily and they are frequently used for street, parking lot and site lighting. IL’s long bulb life (100,000 hours) make them an excellent candidate for high bay lighting applications.
Until this past year operators of commercial buildings with ceiling height more than 20 feet had limited choices for the next generation of energy efficient lighting. LED technology could not measure up to customer expectations for providing uniform light at floor level for high bay fixtures. However, rapid improvements in luminaire design (especially in regard to brightness and glare) and lighting efficiency make LED a competitive choice. Also, the differentiator of pricing between the two technologies is slowly disappearing. Falling prices and rising lighting efficiency is beginning to generate savings that offer payback periods of 2-3 years for LED comparable to IL.
There are many quick and simple comparison charts and tables available on the internet listing the pros and cons of LED and IL. It’s important to understand that these references often promote a point of view where one technology is favored over the other. The negative references tend to focus on the case studies of low quality products which often populate markets when new technologies are rolled out- this is the case with LED.
Operating Factors – Comparison
The comparisons below between IL and LED represent a composite of actual installation experience as a facility consultant for St. Johns University in New York City, an extensive literature review and, interviews with lighting engineers and the Association for Energy Engineers:
- Lighting Efficacy (lumens per watt – l/w)
- LED – 85 -95 l/w; New generation LED bulbs are reported to have efficacy values of 110- 120l/w. Philips Lighting has reported development new LED bulbs with efficacy values exceeding 200 l/w.
- IL – 70 – 85 l/w
- Color Rendition Index (CRI) – Convention centers should consider themselves as a retail environment. CRI values less than 80 are not acceptable. Ask distributors about bulbs with CRI values greater than 80.
- LED – 80
- IL – 80
- Correlated Color Temperature (CCT –in degrees Kelvin) – The higher the CCT the more clean or bluish the light quality. A lower CCT (<3000) will produce a warmer light quality.
- LED – 2,700K – 6,500 K
- IL – 2,500K – 6,500K
- Lamp/Bulb Life (in operating hours)
- LED – 50,000 to 55,000 hours
- IL – 100,000 hours
- Lamp Lumen Depreciation (LLD – % lumen loss over time)
- LED – LEDs will see a gradual decrease very similar to IL in lumens to 50,000 hours then LLD will drop steeply. This performance is dependent on the ability of the fixture to dissipate heat. LLD will be greatly accelerated if this cannot be controlled.
- IL – IL bulbs lumens decline about 10% in the first 10,000 hours then remain fairly constant until about 70,000 hours when LLD begins to drop steeply
- Light Dispersion Characteristics
- LED – LED has more flexibility with light-distribution patterns. With LEDs and their secondary optics, you have the ability to get the light where you need it.
- IL – Induction luminaires must be used with a reflector in order to make use of the total light output.
- Glare Characteristics
- LED – Can be a serious problem. Poor fixture design and elevation placement can cause very distracting glare with LEDs. LEDs light comes from tiny sources that create very high brightness from a very small area — very high nits or candelas. The key to success is optics. This is no small matter to convention center management and you have to get it right.
- IL – Not a problem with properly designed luminaires
- Reliability (Failure Rates)
- LED – There are reports of unsatisfactory reliability from poorly manufactured fixtures and bulbs. Convention center managers are wise to rely on a high quality LED manufacturers (GE, Philips, Lumileds, Cree, Nichia, OSRAM) to ensure reliability
- IL – A more mature technology with a good reliability record
- Ambient Temperature Sensitivity
- LED – Very sensitive to sustained high temperatures (>25 degrees C or 77 degrees F). Many high-bay LED fixtures feature a horizontal top surface that’s susceptible to dirt accumulation. This reduces the fixture’s ability to keep the lamps cool. It will also reduce lamp life and increase LLD. Fixtures with vertical fins are less prone to clogging from dirt. For exhibit halls in most of the US, there is a definite stratification of temperatures in exhibit halls especially during event move in and move out. Temperatures at elevations above 25’ can easily exceed 90 degrees F. If LED is elected, be sure to compare a fixture’s rated temperature to the expected ambient conditions. Otherwise, you may have to consider de-stratification fans (paddle fans won’t do). If choosing LED obtain the lamp/ with the best temperature performance.
- IL – Much better performance at high ambient temperatures (50 – 100 degrees C or 122 to>200 degrees F) with little to no effect on lumen output or lamp life
- Fixture Appearance
- LED – Some of the heat sink designs make the fixture look very unconventional. Also a flat topped fixture is likely to accumulate dirt.
- IL – Very conventional looking fixtures.
- Warranties
- LED – Presently up to 5 years
- IL – 5 to 10 years
- Disposal of Hazardous Waste
- LED – There may some exotic elements in the circuitry. Ask the manufacturers and pay attention to environmental protection regulations
- IL – IL contains a small amount of mercury. The disposal of mercury is regulated and requires special procedures
Recommendation
We are clearly in favor of LEDs over IL. The pace of improvements in all operating factors is very rapid and we believe the IL advantages, such as lamp life, will slowly disappear. We advise that if elected, you choose on the basis of quality considering all factors, not simply energy savings. This means relying on brands that have a history and indeed legacy of manufacturing quality lighting products. Other factors to consider in this decision are listed below:
- Certainly no convention center manager wants to be faced with a highly visible failure of LED fixtures. For LEDs, there is still uncertainty regarding consistent quality as industry wide and governmental standardization and regulation continue to evolve.
The DOE Energy Star program is one where you can find standards which should give some safety and direction to a decision to installed high bay fixtures:
Look for the ENERGY STAR label. ENERGY STAR means high quality and performance, particularly in the following areas:
- Color Quality
- 6 different requirements for color to ensure quality up front and over time
- Light Output
- Light output minimums to ensure you get enough light
- Light distribution requirements to ensure the light goes where you need it
- Guidelines for equivalency claims to take the guess-work out of replacement
- Peace of mind
- Verified compliance with more than 20 separate industry standards and procedures
- Long term testing to back up lifetime claims
- Testing to stress the products in operating environments similar to how you will use the product in your home
- 3 year minimum warranty requirement
All ENERGY STAR products are subject to random testing each year to ensure they meet the ENERGY STAR requirements.
- Consider the fact that most of the retail world is converting to LED. The exhibit floor during a trade show is very much like the retail environment.
- Philips Lighting has entirely abandoned Induction lighting and is actively promoting LEDs over all other lighting technologies (at which they are the global leaders).
- Convention center finance managers have grown used to very favorable ROIs and paybacks for lighting improvement projects, usually less than 3 years. In this instance, where the higher cost may push the payback higher, we recommend a life cycle costing evaluation. If capital is a problem, there are many rebate programs available related to demand reduction as well as straight energy conservation through your electric utility and/or state government.
Before you launch a lighting replacement program with LED in mind, we recommend that you engage a lighting engineering group, one that has many retail clients. In lieu of hiring a lighting engineer, choose a lighting distributor that has no strong business ties to either IL or LED manufacturers. In fact a record of installations using both technologies should be a prerequisite. Narrow your choices but first do a test in one or more areas of your exhibit halls, take measurements and seek reaction from some of your clients.
