In a Business Recovery Mode – Thoughts on a Convention Center’s Telephone/Internet Business Model

AUTHOR’S NOTE: This article was co-authored by Patrick Sarcinella. Patrick has over 25 years of event technology experience in the convention industry. His experience includes positions as Sr. Director of Sales for Millennium Technology Group (Rosen Hotels and Resorts) and Sr. Director of Southeast Operations with Smart City Networks, where he worked for over 16 years of his career, As part of this position Patrick led the Smart City team at the Orange County Convention Center.

The timing coincidence of two random events – the pandemic, and the other, the rapid success of groundbreaking improvements in wireless communications, have made the future of internet services at convention centers challenging.

As this issue of The Convention Center Advisor is being written, event market uncertainty persists. Convention centers have again been re-purposed from field hospitals, homeless shelters and COVID testing sites, to new roles as vaccination-sites and temporary shelters for unaccompanied migrant children. Until recently business reporting favored the dark side. Cancellations of leading sector events scheduled for Q2 2021 were reported regularly. Economic consultants serving CVBs and tradeshows were predicting a return to pre-pandemic event numbers anywhere from 2022 to as late as 2024. Grim forecasts for the airline and hotel sectors also portended an uncertain recovery. The International Air Transport Association (IATA) reported that US domestic air travel was down 65% from 2019 with return to pre-pandemic levels coming in 2024. Hotels were also voicing a similar forecast. Reported by hotel data firm STR, the pandemic was projected to erase a decade’s worth of revenue per available room (RevPAR) gains with room demand and average daily rate (ADR) unlikely to bounce back to 2019 levels until 2023 and 2025.

Now that Q1 2021 has come to an end, there are positive industry news stories about events taking place, albeit smaller and often virtual. Last month at a conference for the Association of Performing Arts Professionals, Dr. Anthony Fauci expressed optimism that live concerts and festivals could return sometime this Fall. Most believe this news also applies to conferences, conventions, and tradeshows. Vaccination progress improves daily and is reflected in most market news. Normally circumspect Forbes Magazine, in a March 1st article titled “Trade Shows Will Regain Importance After the Covid-19 Pandemic”, predicted a healthy comeback for tradeshows. The writer, Bill Conerly, characterized it this way, “Companies, like bicyclists, can coast now and then, especially if they have good momentum and especially if their competition also coasts.  However, when competitors start pedaling again (or peddling), companies that ignore trade shows will fall behind. The benefits of exhibiting will help trade shows and conventions to resume, though with some changes.”  A more cautious tone was expressed in a recent Wall Street Journal article on March 14th. Some recognition was given to tradeshows which have been piloting events of reduced size as well as ‘hybrid’ events that combine live exhibits and virtual presentations. However, the Journal opined that tradeshows will not return to their pre- COVID levels until 2023. For us, in conversations with industry contacts there is talk of fewer event cancellations, the recall of furloughed employees, and renewed enthusiasm from the exhibiting community for resuming tradeshows. Nevada’s Governor just relaxed capacity limits for mass gatherings to 50%. Our sense is that consumer pent up demand is transforming from palpable to tangible, evidenced in part by a surge in discretionary spending and experiential activities like restaurant dining and travel. Let us hope the “animal spirits” that drive today’s stock markets will revitalize our industry as well.

Where Things Stand –Business Environment Considerations for Convention Center Communications Services (Telephone – Analog Wired and Cell Service, WiFi Service, Wired Internet Service)

Given this business environment, it’s time for convention centers to actively plan a re-opening strategy. The business consultancy, McKinsey, expressed it this way, “….,organizations are transitioning from their only agenda item being near term survival to peering through the fog of uncertainty, thinking about how to position themselves once the crisis has passed and things return to normal”. We all sense that the “new” normal will be quite different than 2019. As the recovery takes hold, we will see fewer events, smaller in size and less attended. Convention centers will have a multitude of challenges, some of a general business nature such as:

• Getting as many events as possible through the doors and regaining 2019 their market share of events.
• Reckoning with stark reductions in event service revenue due to fewer exhibitors and attendees. Also, expect demands for rent concessions from event organizers who have the advantage of a buyer’s market.
• Dealing with the possibility of reduced subsidies to support operating deficits and capital projects. One prime source, hotel occupancy tax receipts which are already at diminished levels, will have a difficult recovery.

Other challenges deal directly with the convention center’s phone and internet service:

• Having capital resources to catch up with the pace of digital technology innovations that have been popularized during the pandemic.
• Developing a plan that prepares for increased internet service demand due to growth forecasts in 5G mobile device ownership and use.

On an operational level:

– Improving the relatively poor WiFi quality of service experienced with slow speeds and lost connections.
– Dealing with sub – standard cell phone coverage in many parts of convention centers with degraded signal
strength and dropped calls. These problems are due to the facility’s dense concrete and steel construction or LEED approved glass exterior curtain walls.

The graphics below depict the scale of capital and operations expenses for different size convention centers:  

Pandemic Recovery – A Business Case for New Capital Investment

WiFi6

  1. The industry changed the naming of specific wireless internet services to something simpler and memorable. That means the technical standard, IEEE 802.11, became WiFi. and follow – on versions were named in sequence, so Wifi 4 became WiFi 5 and now WiFi 6. Within the standard for WiFi 6 is a feature called Orthogonal Frequency Division Multiple Access (OFDMA) which differentiates WiFi 6 from other WiFi versions in a material way. The feature solves convention center WiFi’s most vexing problem. It allows multiple users with varying bandwidth needs to be served simultaneously from APs without the nuisance of slow speeds or sudden loss of connection. It supports earlier WiFi versions with better performance and provides a platform for innovative applications, such as 4K video streaming, virtual reality, augmented reality and collaborative apps like Zoom and other video conferencing applications. In sum, WiFi 6 improves speed, capacity, and control.
  2. With technical problems solved, business will improve. It is reasonable to assume that a WiFi 6 equipped venue will likely generate more revenue and improve customer confidence in WiFi quality. It is also plausible that a WiFi 6 venue may have a competitive advantage for booking certain technology events.
  3. WiFi 6 is commercially viable. Many large venues, particularly stadiums, have installed WiFi 6. Examples are, Ohio State Stadium – Columbus, Lucas Oil Stadium – Indianapolis and Nissan Stadium – Nashville. As of this writing we do not know if WiFi 6 has been installed in any convention centers.
  4. Making an investment in WiFi 6 as we come out of the pandemic is a smart way of preparing for a surge in WiFi demand. The surge will follow close behind growth of 5G mobile device ownership. Services such as 4K streaming will become commonplace and you should expect event exhibitors and attendees to use them routinely.
  5. The cost of WiFi 6 can be managed and be gradual. The overall cost has a wide range based in part on the continued use of some WiFi 4 or 5 equipment and communications cable. The purchasing power of the convention center (public venues often utilize the purchasing advantages of state contracts) or the purchasing power and leverage of an outsourced internet contractor like Smart City Networks or Cox Communications will also reduce costs. Know that an outsourced contractor would normally absorb the full cost. Using the cost per AP as a guide, a rough estimate should range from $500 to 1000 per AP. Each AP has an effective coverage of 1,500 to 1,750 square feet.

Note 1: Small and mid-sized convention centers that have a WiFi 4 or 5 system in place that satisfies WiFi demand and service levels for event organizers, exhibitors and attendees may want to delay the WiFi 6 investment until market penetration becomes widespread and therefore necessary.

Note 2: Read the section below titled “5G and the Combination of 5G with WiFi 6 and DAS”.

Improving Cell Service – Distributed Antenna System (DAS) and Small Cells

  1. A DAS or small cells will reduce weak signal strength and dropped calls. For most mid to large convention centers DAS is an elegant solution because it expands coverage, improves \ quality and eliminates capacity shortages. Smaller convention centers should look at small cell technology as an alternative to DAS. Small cells are less expensive than DAS.
  2. A well- designed DAS will enable the convention center to keep up with future advances in cellular technology.
  3. There are alternatives for funding a DAS or Small Cell. If your phone/internet service is self-operated, then we recommend a hybrid business arrangement where the entire process is outsourced and paid for by a DAS owner as an exclusive contractor. There are companies which focus almost exclusively on building out and operating cell sites on properties owned by others. The leading companies are Crown Castle, American Tower Corp., and SBA Communications. Together they own and operate over 100,000 cell sites. You also have choices if phone/internet service is outsourced. You can proceed as described above and have two outsourced exclusive contracts, one for DAS (installation, operations and maintenance) and the other for analog telephone and internet service. For administrative simplicity you could request your current exclusive Phone/Internet contractor to handle the entire transaction and take on the construction and operating responsibilities with the DAS owner and operator as a sub-contractor. Again, the entire process will be outsourced and paid for by others.
  4. The convention center will share in the revenue obtained by the cell owner and operator by renting DAS space to carriers such as, Verizon or AT&T.
  5. DAS is proven and commercially viable. Several convention centers have already installed and profited by it; Las Vegas Convention Center, the Javits Center, the San Diego Convention Center and more.

Note: Read the section below titled “5G and the Combination of 5G with WiFi 6 and DAS”

5G and the Combination of 5G with WiFi 6 and DAS

  1. If yours is a large convention center in a top tier city with a consistent occupancy rate of 50% or more, then it’s resolved. At some point, business demands will force your convention center to become a 5G venue.
  2. 5G uses higher frequency bands which support faster speeds (100 times faster than 4G), less latency, and the capacity to simultaneously handle more devices.
  3. 5G will enable convention centers to provide several advanced, provocative features that enhance events and exhibitor product demonstrations. Listed below are a few of them:

    • Highly reliable connectivity in dense crowded space
    • The ability to view ultra- high resolution 4K video calls. It will also support 8K video which is out of its R & D phase and will become commercially viable in the next few years.
    • Greatly improved virtual environments which replicate reality in a compelling way with clarity and realism. Virtual Reality (VR) and Augmented Reality (AR) are two of these applications.
  4. The combination of WiFi6 and 5G is technically compatible. For a convention center it would first require that the carriers be prepared to offer 5G in the convention center locale and provide the required circuits or bandwidth. Bandwidth costs will increase somewhat but service revenue will easily make up for it. Additionally, there may be equipment upgrade costs.

    The benefits of combining WiFi 6 and 5G are best described in this Cisco infograph:

    cisco.com/c/m/en_us/solutions/enterprise-networks/802-11ax-solution/nb-06-5-things-WiFi6-5G-infograph-cte-en.html

  5. Be cautious. The combination of a DAS and 5G poses some uncertainty. An existing DAS with 4 or 5G compatible equipment will not support the higher frequencies that a carrier’s 5G network does. For convention centers that have a DAS in a 4G network and plan on becoming a 5G network we recommend that they consult with the DAS manufacturer to see if the current system can adapt or be converted to 5G. We doubt it can.

    We found one venue that elected to have a 5G carrier operate with the knowledge that 5G features are only available at the lower frequency range. AT&T Stadium, owned and operated by the Dallas Cowboys, elected to do that in 2019. Their marketing literature is very enthusiastic about their network performance capability. It would be interesting to learn how they came to that decision. It appears the complete conversion from 4G to 5G venue requires a new 5G capable DAS. AT&T Stadium elected to continue with their 4G DAS, operate 5G level services at 4G frequency ranges and forfeit 5G high frequency connections. We believe this is the approach AT&T Stadium took and will probably be reviewed by other sports venues.

    There is one serious critic, Cisco, which expressed concerns about the limiting 5G full capabilities by using a 4G DAS. In a recent white paper they said, “We feel the current set of multi-operator solutions are ill equipped to enable 5G to thrive indoors.” The core of the criticism is that this combination limits the scalability or growth potential of 5G. We presume this is because a 4G DAS cannot operate at the higher frequencies that 5G can. To read the entire white paper click the link below:

    cisco.com/c/dam/en/us/solutions/collateral/service-provider/ultra-services-platform/5g-ran-indoor.pdf

    If the plan is to install your first DAS then the system engineer must specify that the DAS works reliably as part of a 5G in-building network.

  6. 5G is commercially viable if there is a 5G tower in the locale. There are at least 43 stadiums and arenas that are 5G venues. Among them are Citi Field in NYC (MLB – NY Mets), SoFi Stadium in Los Angeles (NFL – Rams and Chargers), and FedEX Forum, (NBA – Memphis Grizzlies). We know of only one convention center which is a 5G venue, the Los Angeles Convention Center.

Pandemic Recovery – A Business Case for Reviewing Internet Service Price Strategy

The FCC investigations in 2013 and 2014 and their 2015 Consent Decree about wireless internet “blocking” cast a pall over the business practices of exclusive internet contractors at convention centers. The Consent Decree affirmed the rights of public use of the internet, prohibited “blocking” and took actions against companies that practiced blocking tactics. Fines were assessed and the venue industry’s credibility as a whole was harmed. These outcomes surprised many convention center managers. In the end though, they recognized the root cause of this controversy as the perception of excessive pricing for wireless internet services. The FCC’s 2015 actions were soon joined by more albeit less dramatic difficulties. Objections about the lack of “free” WiFi arose where event attendees made comparisons to free WiFi available at public libraries and coffee houses like Starbucks. Event organizers were also vocal on this point. The other issues were more subtle and revolved around the generally poor performance of exhibit hall WiFi during large events with high demand. These trials put convention centers and their exclusive contractors in a tough defensive position. Rather than awkwardly defending themselves, they took the high road and proceeded to look for solutions and made changes. Free Wifi quickly became universally offered for “light business” purposes (checking email for example). Contractors continued to wrestle with WiFi performance issues and improvised as best they could while being limited by the current AP technology. This is where things stood at the beginning of 2020.

Now with the pandemic ebbing and business confidence building, an opportunity exists to review pricing strategy with the aim of understanding complaints and objections, preserving profit margins and, venue commissions if outsourced and making sensible changes for the future. Where do we start? How does one approach this in a disciplined way? See below:

  1. Understanding the Nature of Convention Center Pricing
    • Nothing pleases convention center management more than to have event services operate profitably by:
    –  Offering fair pricing based in part on local and competitor market conditions
    –  Growing profit margins organically through sales of premium products and services at premium prices
    • Event service prices are generally high for several reasons:
    –  One obvious reason is that the customer is in effect captive. License Agreement terms require event organizers to use in-house services and exclusive contractors.
    –  A convention center’s physical plant and utility infrastructure is robust in nature. The event industry depends on the scale of the facility, its supporting property elements and the enormous utility capacity and distribution. These characteristics make centers much more expensive to operate than other buildings.
    –  Most License Agreement terms require workers to be labor union members. Service work performed by union labor greatly affects price.
    –   For outsourced services event revenue is shared as commissions with the convention center
  1. Determining which Services are Regarded as Commodities or Premium
    • Make professional judgments about which services are considered a commodity or premium. Commodity pricing should be applied to services which are common, comparatively easy to set up and is in a reasonable range of phone and internet services at other venues. Premium services have opposite attributes from commodity services. They require more programming and testing, take up higher bandwidth and are generally of higher value for exhibiting companies. Higher pricing for more complex and more valuable services is more widely accepted by exhibitors.
    • For many exhibitors it’s easy to characterize the price for some services as a form of price gouging. This is especially true if the prices are far above industry averages for what an exhibitor may regard as rudimentary work.  For convention centers and their exclusive contractors, it’s wise to have a menu of services that effectively mix commodity products and services with premium products and services.  A smart mix presents opportunities to preserve profit goals and control exhibitor complaints and resentment. Easy- to- fulfill orders can be priced more reasonably where there is natural price sensitivity and, value added, customized services can be priced at premium levels.
  2. Taking Inventory – Comparing Pricing for Each Service Category Among Competitors
    • Calculate a mean and a median for each service category. For a self – operated unit, it’s always a good policy to set your prices slightly below the mean.
    • If possible, list the percentage changes in price for each category over the past three to five years.
    • Footnote if time and material charges are applied separately and in addition to service prices and if any sales or temporary utility taxes are applied.
    • Obtain data on service order volume by each service category.
    • Classify services as either commodities and premiums and make this a consideration when making price changes. 
  3. Reviewing Each Service’s Profit Margin
    • Each service category has a profit margin which should remain relatively consistent over time. Margins comparing current data should be compared to the multi-year mean.
    • Profit margin data should regularly be compared to their multi-year mean and median.
    • Knowledge of margin data will reveal opportunities for controlling labor costs and assist in making data based decisions when revising prices.
  4. Actionable Items to Consider
    • Seriously consider going through steps 2 to 4 above.
    • For outsourced services, hold service pricing at 2019 levels and, if services are outsourced, in turn roll back commissions for a time with the condition that the contractor presents a plan for new technology investments. This can be done by a contract amendment that specifies the amount or percentage and a schedule for the roll back.
    • For self-operated phone/internet services hold service pricing to 2019 levels until business recovers measured by occupancy rate growth and/or recovery of 2019 occupancy rates.
    • Think about offering a grand good will gesture to event exhibitors and attendees. Here is one; offer free WiFi up to 5 mbps in such areas such as food courts and lobby entrances. At these speeds video calls with applications like Facetime or Facebook Messenger and most SD Streaming videos will work.  Our guess is that there will be an increase for paid higher speed services so exhibitors and attendees can view 4K streaming. Know that CNET recently reported Starbucks offers free WiFi at 51.16 mbps, Taco Bell 14.29, Arby’s 14.24 and Subway at 4.78 mbps.
    • Both self- operated and outsourced operators alike should sharpen their marketing and service messaging to exhibitors. Focus on the following:
    – Fully understanding your pricing power and confidently defending premium prices. Developing a business logic and technique to defend premium vs. critics and competitors.
    – Launching innovative and differentiated services at premium prices. Experienced managers can introduce new technology and services that create genuine and proven value for event exhibitors and event organizers.
    – Raising prices annually without losing demand.

COVID – 19 and its Effect on Convention Centers: Causes, Explanations and Thoughts on Recovery

Author’s Note:  This is the first issue of The Convention Center Advisor that I’ve written for some time. I hope you find it informative.

I have just completed a book about managing convention centers titled. Improving Convention Center Management Using Business Analytics Key Performance Indicators. The book has two volumes, one focusing on fundamentals and the other on advanced practices. The book is published by Business Expert Press (BEP) and should be out now for sale. View a synopsis of the book on my website: http://www.conventioncenternow.com/look-inside-myles-mcgranes-new-book-improving-convention-center-management

To purchase the books, go to: Business Expert Press and click on the book covers.  

January’s announcement restricting travel between the US and China was sobering but not serious enough to change our way of conducting business meetings. Then in late February, a biotechnology company, Biogen, held its annual leadership conference, One hundred and seventy – five executives gathered at the Marriott Long Wharf Hotel in Boston. The conference was spread across the multiple meeting rooms and ballrooms. There were research presentations, new product discussions, and business planning sessions. The conference also included scheduled group meals, coffee breaks, socializing and good fellowship. This setting belonged in our wheelhouse, in short the conference setting and service helped fulfill all the goals of a well-planned business meeting, Soon after the meeting ended, attendees and others associated with the event became ill. The ominous result was what medical researchers call a “super-spreader”. More than 90 people (Biogen managers and conference and guest service workers), became infected with the COVID -19 virus. The virus then spread throughout the Boston area and, as the virus’ hosts traveled home, to other states and on to parts of Europe, Asia and Australia.

Mass indoor gatherings where socializing is expected and encouraged are the ideal setting for virus spread. Indoors, the virus thrives on a crowd density which gives it a variety of available hosts over a short time period. More super spreading events followed in the spring and into summer from funerals to house parties and church choir practices. Then in late July the bell-weather of all live events, The Consumer Electronics Show in Las Vegas cancelled its January show. Other large events followed with cancellations; the National Association of Music Merchants Show, the Specialty Equipment Market Association Show, the Automotive Aftermarket Products Expo, and most recently the New York Toy Fair. Wisely most corporate events, tradeshows and association meetings, our clients, had already shut down or postponed operations. Convention centers were converted into field hospitals, supply and distribution centers, testing sites and even municipal court rooms. COVID – 19 was upon us.

Why Has the Exhibition Industry Been so Severely Affected?

The depth and profundity of COVID – 19 has brought about global economic instability. The arrival of the pandemic, just 12 years after the 2008 Recession, has affected all market sectors and all business functions. The result has been mass unemployment, huge government subsidies, deferred or cancelled investment plans, business failures, unpaid bills and sickness and death. The event industry cannot function in this environment. More familiar business risks such as, market risk or technology failure, seem insignificant now. The type of risk the world is experiencing today is called systematic risk by the investment community. Investopedia describes systematic risk as:

  • Risk inherent to the market as a whole, reflecting the impact of a global economic breakdown like the Great Depression, political upheaval, or a war spread across many countries.

For certain, worldwide pandemics need to be included as a systematic risk. In this case a biological calamity suddenly and swiftly spread globally, slowing or shutting down the world’s economies.  

  • Unpredictable and difficult to avoid.
  • Risk thatcan be somewhat mitigated if a company has a diversified lines of business

There are unambiguous and foundational causes for the rapid cancellations of conventions, conferences and tradeshows:

  • The rapid spread of infection caused by everyday face to face communications. One can envision a convention or tradeshow being conducted today as if it were 2019 becoming a “super spreader”.
  • The death rate of COVID – 19 for certain age groups and conditions
  • Uncertainty about a new surge or “second wave” of infection much like the 1918 Flu pandemic
  • Government shut down of all non-essential businesses and mass indoor gatherings
  • The lack of therapeutic treatments and a preventive vaccine
  • Re-purposing of convention and exhibiting facilities for emergency services; field hospitals, supply and distribution centers and testing sites for the virus
  • Restrictions on interstate and international travel

Can Recovery for our Industry Be Forecast?

The state of the national economy has direct influence over our industry performance. As the economy advances or declines so do conventions, conferences and tradeshows.  A useful measure of convention and tradeshow performance comes from the Center for Exhibition Industry Research. (CEIR).  The CEIR Index is derived from key performance indicators from14 economic sectors. The indicators are; event net square footage, attendance, event organizer revenue and number of exhibiting companies. The index is the geometric mean of indicator values from all economic sectors.

National economic performance is described using Gross Domestic Product (GDP).  GDP is the sum of spending by consumers, government, and businesses plus net exports. It is expressed as a percentage change from one period (quarterly or annually) to the next.

The CEIR graphic below depicts the index performance from 2000 to 2019. The graphic was published before the pandemic so disregard forecasts for 2020 and 2021.  Note the steep decline in 2001 to 2002, representing the 9/11 attack, and the same for 2008 to 2009, representing the Great Recession. Below the CEIR graphic is a line graph of annual Gross Domestic Product (GDP) for the same period.

Source: PCMA website, https://www.pcma.org/events-industry-forecast-exhibition-industry-evolves/

Source:  US Bureau of Economic Analysis (BEA) and the Federal Reserve Open Market Committee’s June forecast

GDP and the  CEIR Index components of  net square footage,  event attendees and number of exhibitors  have moderate to strong correlations of .58, .75 and .52 respectively. This provides a statistical basis for GDP’s direct influence over our industry’s performance.

Although the units of measure are different for GDP and the CEIR Index components, there are other statistical similarities which tell a story. Most notable were the sharp drops in GDP due to global events. In the 4th quarter of 2001, just after the attack occurred, the GDP dropped to .15.  The annual GDP for 2009, as the effect of the recession took hold, dropped to – 2.5. In 2nd quarter of 2020 GDP dropped to –31.7, the lowest recorded since the Great Depression. This portends a disastrous year for our industry. We already know this to be true.

The graphics also show that recovery of GDP and CEIR Index components begin at about the same time. However the shape of the recovery and the rate it progresses are very different. The GDP recovery was V shaped both after 9/11 and the 2008 Recession. The CEIR recovery is not V nor U shaped in either instance. Rather it is shaped like an exaggerated checkmark with the left side of the check showing a sharp decline and the right side curved and elongated. The inference is that the exhibition industry recovers at a slower pace than GDP after a global event.

In the current pandemic however there are strong opinions that differ with the Federal Reserve Open Market Committee’s June forecast of a GDP V shaped recovery in 2021. In The Wall

Street Journal’s July Economic Forecasting Survey of Economists (reported in a blog published in the Yields-4u website), most surveyed believe US economic recovery would be shaped like the “Nike swoosh”. A smaller percentage believed it will be W shaped.

In the July Economic Forecasting Survey by The Wall Street Journal, which polls more   than 60 U.S. economists each month, 13.0% of respondents thought the recovery would be V-shaped, 11.1% expected it to be W-shaped, 5.5% indicated it would be U-shaped, and none thought it would be L-shaped. The vast majority — 70.4% — believed the recovery would take a “Nike swoosh” shape, which suggests a sharp drop followed by a   long, slow recovery. This view factors in the possibility that businesses may be slow to rehire, and consumers could be slow to resume pre-recession spending patterns. It also considers that some businesses may be impacted longer than others. Airlines do not expect to return to pre-COVID passenger activity until 2022, and movie theaters, beauty salons, sporting events, and other high-contact businesses may struggle until a vaccine is developed.

Economists and analysts elsewhere seem to favor the “swoosh” or checkmark recovery. The graphic below from the State of Oregon Office of Economic Analysis likened the shape to the square root symbol. They also offered this brief explanation of recovery: After we have control over the public health side of things, then the economic   recovery may exhibit more of the classic U or V shapes depending on a variety of factors, including how much permanent damage is done during the recession, number of firms   that fail, displaced labor, demand destruction, etc. – plus consumer’s pent up demand, monetary and fiscal policies and the like.

Source: https://oregoneconomicanalysis.com/2020/04/07/covid-19-the-square-root-recovery/

Beyond these explanations, for our industry the big question is whether and how the virus has fundamentally changed the way we conduct business.

 “It’s tough to make predictions, especially about the future”. Yogi Berra was a wise man.

What Event Organizers Are Facing

For event organizers the recovery process will be complicated. I took time to join Event MB’s webinar “The Future of the Event Industry” a few weeks ago. I learned this:

  • Small trade and consumer shows that have prospered pre- pandemic but have relied principally on cash flow and modest cash reserves have been forced to operate with minimal staff. Some have simply suspended event operations except for a small level of administrative activities. Launching virtual events where revenues are much less and hard to predict compared to live events is not a workable solution with this uncertain period. Theirs is a “wait and see” strategy.
  • Large well – capitalized organizers have a much better chance of getting through this with their brand intact and the prospect of having live events again. Speakers at the webinar discussed the advantages of large event organizers and used Reed Exhibitions as an example. Reed is an operating unit of RELX, a global provider of information based analytics for businesses and professional clients. In December 2019 they were an 8.7 billion dollar company. Reed contributed 16% of that revenue and 13% profit. So RELX provides the strength and resiliency for Reed to ride out the pandemic. Being part of RELX provides the resources to engage in digital services for exhibitors such as, virtual product showcases and demonstrations, on-line lectures and education seminars, etc. The         speakers believed that this form of thoughtful pro-active communication is necessary to keep the event brand fresh and exhibiting companies interested. Conversely, those event organizers unable to sustain the connection with exhibitors put themselves at considerable disadvantage making recovery more difficult.

The well – capitalized event organizers may have other things in mind if they don’t have to be concerned about declining revenues or the process of insolvency. There are no doubt smaller event organizers who are eager to sell assets to generate operating funds. Some of the assets may be events that fit well into a larger organizer’s portfolio. I expect any M & A activity to be a buyer’s market. With the absence of any organic growth, thoughtful acquisitions may be the only growth strategy.

There are other impediments for event organizers’ recovery efforts.  Some are obvious but others have surfaced and are evolving:

  • Event organizers willing to open a live or hybrid event have been confounded by some convention centers that remain closed so they can be used for emergency medical services should a second wave of the virus occur. There are others who are non – committal about opening for business or, as with McCormick Place, plan to stay closed until an effective vaccine is deployed.
  • The business press hasn’t been helpful. An article in Barron’s (June 26th) was titled “Big Trade Shows Have All Been Cancelled. Why They May Never Come Back”. The article had plenty of examples. Here are two of them; at this year’s Apple Developer’s Conference nine million people watched Tim Cook’s keynote speech in an apparently flawless presentation from the Apple campus; a recent Cisco Live event had 125,000 virtual attendees vs. 28,000 attendees they expected at the live event. Also, Forbes Magazine through its Forbes Technology Council recently published a post titled, “Bringing the Value of Face-To-Face Interactions into Virtual Meetings, Briefings and Events”. The article stated that only 6% of exhibitors and 34% of attendees said trade shows had helped meet business objectives. Further, the author implied that B2B buyers (91%) prefer to consume interactive and visual content, opening the door to greater reach and awareness.
  •  In business as in physics “nature abhors a vacuum”. With no live events, technology in the form of virtual events has advanced to the point where elements of a trade show can achieved virtually and reasonably substitute for certain live experiences. Distance learning is a virtual format and has been in use frequently for conferences. The feature of interactivity has increased its popularity. However, virtual will be new for tradeshows and association events with exhibit booths. Many of us have read about or seen demos of virtual exhibit floors and booths but the concept never really made headway until now. The technology has vastly improved since introduced. I see virtual as a possible impediment to recovery due to the surge of advertising and media attention that virtual is currently receiving. The companies behind virtual events are not hesitant to promote virtual events as a new marketing method to rival and replace  live events. Some of their arguments are persuasive, especially the cost of producing a virtual exhibit booth vs. all the costs associated with a live event. Some exhibiting companies will be persuaded to adopt the virtual methods of promoting their product and service. I believe, however, that there is too much technological risk and misplaced confidence that a screen image, even if interactive, can replicate being there, to speak directly to someone and engage the five senses. Organizers that already are or intend to use virtual during the pandemic know that the revenue model for virtual is much less  than live. A recent CEIR blog described the difference as “trading dimes for dollars”. Organizers know however that virtual will have to play a part in future tradeshows and conventions. How can they integrate it properly into traditional event formats and effectively monetize its features?

Many event organizers are planning a combination live and virtual program they call “hybrid’ for possibly the 3rd quarter of 2021 for some the hybrid format is viewed as a means of keeping their larger exhibition on everyone’s business agenda and schedule until the pandemic is brought under control and mass indoor gatherings resume. If  successful the hybrid format may become the preferred event format.  This will be a difficult cultural transformation for some event organizers. The switch from a high density setting with crowded aisles, plentiful face to face interactions be it buying, selling, questioning, networking, etc., to a controlled and technology-based environment will take a level of organization and finesse that is not in their playbook. In the long run the benefits should outweigh the risks in producing a hybrid event. Virtual could be a valuable and innovative supplement for many trade shows and association conventions alike. Denzil Rankine, Chairman of the consultancy, AMR International believes that:

Virtual will not recreate the intimacy of live and not all tradeshows will be viewings of art fairs and other cancelled events replicating their main elements virtually will spread. Virtual will not be just about maintaining contact with communities in the case of cancellations. When normal business resumes virtual will have earned its place, extending reach both during and also between events.

Alternative virtual event formats are either in development or already launched. As an example, one event organization I follow is the American Society of Hematology (ASH). ASH is a not-for-profit professional association. They and like associations differ from privately owned and operated tradeshows in that earning revenue from the event is secondary to their mission of advocacy, professional standards and training and as a conduit for professional contacts and research.  ASH’s annual meeting was originally scheduled for early December at the San Diego Convention Center. It was cancelled and replaced with a complete virtual program on the same dates. Their program is rich and comprehensive with a full schedule including; general sessions, presentations of scientific papers, workshops, symposia, continuing education and exhibitor and product showcases. In preparation for this article I talked with Bill Reed, ASH’s Chief Event Strategy Officer. He related the importance of this event to their scientific and medical community.  Normally attendance approaches 30,000. It is the seminal gathering for this profession. The success of this virtual format is essential for ASH as they have other events throughout the year. ASH’s use of virtual may extend further into the future than other events. Because their annual meeting is for health science professionals, they will be very cautious about live events until real progress is made to stop COVID – 19 spread. Other health science events will probably think likewise.

  • Airline industry business problems such as fewer direct flights and inconvenient schedules as well as reluctance by professionals to fly will not be solved easily.
  • Not to be overlooked, there is the common sense element of fear of infection easily brought about by a trip to a live tradeshow or convention. Safe within their routine of a secure office or plant where health regulations are rigorously enforced, employees going to a live event in a distant city face an infection risk at the airport, in the airplane, the taxi, the hotel, the city streets, the convention center, perhaps a restaurant and then the same places as the  process reverses. Why would a company or an individual take  that risk or even consider it until a vaccine has been invented and proved effective?

What Convention Centers Are Facing

An objective view for convention centers sees a grim future stretching into the 3rd or 4th quarter of 2021.  Indeed, the unpredictable severity of the virus’s second wave and the uncertain timing of a vaccine are maddening conditions.  For convention centers, many have been told to suspend business operations in order to help manage second wave effects. Meanwhile complementary industries and businesses are struggling to survive; airlines, hotels, event service companies, restaurants, and more. .

Some of a convention center’s financial risk has been offset by reductions in payroll with lay-offs, furloughs and salary reductions. Certainly utility and supply costs have been reduced also. For some there may be rental revenue from housing all the medical and other emergency services during the height of the pandemic. For now the same subsidy payments that have always supported convention center capital and operating budgets are in place. In the short run, when events resume, expect them to be smaller with less exhibitors and attendees and less earned revenue from rent and services. In the long term however, convention centers face a more serious problem. The pandemic has caused steep and troubling drops in hotel occupancy. The Hotel News Resource website reported US hotel occupancy hit a low point in March of 22%, then climbed to a high point of 50.1% in mid August. Presently it is about 49%. The occupancy rate for early September 2019 was at 71%. When you combine corresponding declines in RevPar and ADR, the result is a serious decline in hotel occupancy tax collection.

For convention centers these taxes support three essential financial functions:

  • Debt Service Payments (if the fund source for center construction was revenue bonds) -The revenue source is normally hotel occupancy taxes sometimes supplemented by car rental or restaurant tax. Bond holders have to rely on income generated by the project to make interest payments. The income is a portion of the price of a hotel room. Investors regard this as more risky than general obligation bonds and the bonds generally pay a higher interest rate.
  •  Funding Capital Improvements –  For convention centers this is often an expansion of space or building renovations
  •  Covering Operating Deficits – Most of the convention centers in the US rely on revenue transferred from hotel tax receipts or some other form of subsidy like a state tourism fund to cover operating losses.

Starting in April news reports about decreasing hotel occupancy began to surface. Now every week there are news reports of fewer hotel guests. These reports often include commentary about cities or states concerned about using reserve funds to pay debt service for convention center bonds. If the bond sale was well structured the reserve funds are designed to continue debt interest payments through difficult periods. I know of no circumstance where convention center bonds have defaulted nor forced to use reserve funds to pay scheduled interest payments. But we’ve never faced such a severe economic downturn before.  However bond market analysts are beginning to sound the alert. Below is an excerpt from a report written by S&P Global Ratings titled “Outlooks On Certain U.S. Convention Center And Sports Authorities Revised To Negative From Stable On COVID-19 Impact”:

…..a prolonged environment of limited to no operations will greatly hamper the entities’ ability to meet debt obligations, as they do not have other significant stable revenue streams to   rely on and generally have limited local authority to raise new revenues. Although we expect      convention center authorities will do everything in their power to create environments that are conducive to hosting large gatherings and using their facilities, including contingency planning, altering operations and budgets projections, and working with local, state, and federal officials, their ability to do so may be largely out of their control if the current crisis persists.

Convention center managers should be most concerned about the lack of capital funds and coverage of operating losses. What will happen if the pandemic continues to limit hotel occupancy? What will happen if debt service takes all the hotel occupancy tax receipts? What can the convention center do to support itself? Convention center management has tried to increase earned revenue from rent and service fees and commissions, therefore decreasing the need for subsidies to cover operating losses. Some have been successful and achieved positive cash flow consistently. Few have been able to build a capital reserve for building improvements. This will become a major dilemma, possibly long term.

A convention center’s path to recovery will follow a similar path and trajectory as the event organizers. Know that it’s probable as bookings resume and events re-schedule, that space requirements, number of exhibitors and attendees will be reduced. Some events may be of fewer days.  Expect most attendees to come from regions within reasonable driving distance, so overnight hotel stays will be less.

A Plan for Convention Center Management in the Interim

Board chairmen, CEOs and general managers should sense that now is a good time to devise a plan. Business is slowly returning, GDP and employment growth will consistently improve and the vaccine news is mostly favorable.

  1. First things first; achieve GBAC or equivalent certification for facility safety and cleanliness
  2. Assemble your team, key department and division heads, not too large. As a starting point, Finance will present a thorough data based report on current financial status vs. plan before the pandemic. Sales will do likewise.
  3. Develop a list and fact based description of plausible scenarios. The scenarios should include an optimistic, pessimistic, a current momentum and a most likely case scenario. Each scenario should follow the same framework for issues and concerns outside the convention center’s control; the pandemic status, the vaccine development and deployment progress, government regulations and policy and the status of existing event clients. Example below:

Optimistic Scenario

COVID -19 – CDC forecasts a weak second wave for COVID – 19. However, they expressed concern about upcoming flu season and pressed states, regions and cities to aggressively promote flu vaccine shots within the next month

Vaccine – Trials are successful and deployment is ready to begin in the 1st quarter 2021

Gov’t – Restaurants will be cleared for indoor dining by 1st quarter 2021

Clients

  • All of retained clients have made inquiries about resuming business in their normal date cycle by starting in late 2nd quarter 2021. Expect 15 -25% fewer exhibitors.
  • Health Science events (there are 3)  scheduled in 3rd and 4th quarter 2021 are still non – committal
  • Lots of inquiries for consumer event clients, at least 20% more than 2018 and 2019.

4. Adapt the current business model (in place before the pandemic) to each scenario, Consideration should be given to the following:

  • Expanding targeted markets to achieve greater occupancy. This “push everything through the front door” strategy is provocative and has risk, but such a compromise of sales strategy may be a necessity. You may be surprised what you find. A good example is how mid and small sized convention centers found certain indoor scholastic sports competitions a valuable market for earned revenue as well as out-of –town attendees.
  • Review existing rent and service pricing. The market may well be highly competitive with competitors offering substantial discounts to regain market share.
  • Review any capital funds remaining. Firstly, consider postponing any expansion plans you may have. You don’t need to build space you cannot fill. Think about improving the value of the space you have. Consider amending plans to accommodate expected event formats which have less exhibit space but more virtual and digital services. How can convention centers re-direct or obtain funding for improved communications infrastructure?
  • Take on more services as building exclusives. This will cause controversy with event organizers who rely on commissions from service contractors they select. In the long run this is a fight worth fighting, especially with respect to high value services like electric. The convention center will need more revenue sources if subsidies become limited.

5. Plan on continually stress testing the business model adaptations against changing economic scenarios and frequent review of key performance indicators.

The Riddle of Pent Up Demand and the Sensibility of Face to Face Communication

Both pent up demand and face to face communications are inherent business concepts and part of our industry. There is no precise unit of measure to describe or quantify them, but there are available indicators that suggest their significance. I hope this narrative and explanation elicits an appreciation of their influence and importance.

Pent up demand is an inexact science but I know it exists in our industry..In my time at the Javits Center I experienced the power of pent up demand. The first time was when the business was reorganized in the mid 1990’s. At that time the center had an occupancy rate of about 39% trending downward. It was caused by a combination of corrupt, unproductive union labor and an absurd competitive event policy. The competitive event policy established long non-compete windows for existing events, in particular luxury goods, fashion and technology. Rapid reform of the labor issues and cancellation of the competitive event policy led to an occupancy rate of above 60% within two years and trending higher. Pent up demand came alive for us and did so dramatically. The second time was after 9/11. We had already begun to see strong weakening in net square footage use as a result of the dot- com bubble failure. In 2000 and 2001, the center

still had many technology sector clients as we witnessed their rapid decline. Then came 9/11. In the weeks following the attack we changed our marketing plan to include emphasis in other targeted event markets. The event inquiries and competition for dates were immediate. The result was 70% occupancy. I experienced pent up demand first hand but am ill-prepared to explain it properly. The thoughts and opinions of Scott Hoyt, a Senior Director at Moody’s Analytics, were helpful and are paraphrased below.

Pent-up demand is often discussed regarding consumer spending for durable goods such as appliances and automobiles. The US Bureau of Economic Analysis tracks these purchases nationwide and knows well the useful life of those products. When replacement spending does not meet forecast replacement as may happen during a recession, economists see this as a setting for pent up demand. The longer a consumer puts off buying a replacement, the stronger the desire to replace becomes. For other sectors such as business to business spending, there is no comparable unit of measure. However, a reasonable comparison can be made to the way consumer pent-up demand builds during a recession. Recessions are normally accompanied by higher household savings. Saving then falls during the recovery when consumers increase spending. This could easily compare with investors and large companies accumulating large cash reserves when there is high economic uncertainty as during a recession. The inference is that business spending behavior is similar to consumer spending behavior. In Scott Hoyt’s words, “consumers will lead the way.” Accepting that proposition, one can apply pent-up consumer demand for non-durable goods such as clothes and services such as vacations and discretionary medical procedures. Two services that come to mind are pricey vacations and going to the dentist.  They are often put off during recessions, but come quickly back in focus as conditions improve.

There is another useful theory that uses the path spending would have taken with no recession. The approach assumes that income and employment had continued to grow and interest rates and unemployment were stable. So if CEIR forecasted 3.2% growth in the exhibition industry and a recession occurs, there would be a gap between forecasted and actual growth. Does the gap represent pent up demand? It is quite possible during a mild short lived recession, but our current economic downturn is so severe and long that profound changes in supply and demand  would invalidate theory. It’s good to know what the target was though and use it as a benchmark. Pent up demand is an inexact science but I know it can be applied to our industry and its understanding will instruct and possibly guide us through recovery.   

The Sensibility of Face to Face Communication

Face to face business dealings and transactions is a time honored concept dating back to the Middle Ages at mid-eastern bazaars or trade fairs in Europe. It has the quality of being able to see the other party close up and observe and read the way they express themselves not just through speech but also through facial expressions, body language and interactions with others. How else would one conduct business in an organized marketplace? The tradeshow, convention and consumer show is a business environment designed for personal contact and it has worked and grown successfully throughout the world.

Why is the emphasis on face to face communication so important? It’s not just the intimacy of speaking face to face. It’s also the direction a conversation can take, from the mundane to a shift for an esoteric idea that spontaneously grows into a business deal, an idea for a new product, an opportunity for business collaboration and more. It’s difficult to see this happening on Zoom. Some time ago Steve Jobs remarked that face to face communications would always be with us. He said, “There’s a temptation in our networked age to think that ideas can be developed by email and iChat. That’s crazy. Creativity comes from spontaneous meetings, from random discussions.”

There are other qualities and attributes of the role face to face communications plays at a tradeshow or convention:

  • Communications is much clearer. It’s easy to misread and misinterpret information from a phone, email, text and even a video conference:
  • Both verbal and non-verbal cues in a face to face meeting reveal something about the other party’s sincerity, trustworthiness and possibly more. These things are important and should cause you to research the facts and ideas from the conversation further.
  • The conversation is more focused. The other party probably won’t be looking at personal messages on their cell phone as they probably do in a video conference.
  • For a small business the opportunity to meet and talk leaders in the field and potential buyers of your product or service at a convention or tradeshow provides an accelerated path in marketing strategy

From The Plague by Albert Camus; “And indeed it could be said that once the faintest stirring of hope became possible, the dominion of plague was ended.”

In the US “Convention Centers Are Not Designed to Make a Profit” – A Contrarian View

Profit is a fungible term for convention centers.  Sometimes it is expressed properly as you may see it in a public corporation’s annual report. Sometimes it is expressed where revenues include unearned income (such as a government contribution, normally a hotel tax). To avoid confusion this article uses EBITDA (acknowledging that convention centers pay no T – tax).  EBITDA is described as a way to evaluate a company’s performance without having to factor in financing and accounting decisions or tax environments. Non- cash expenses of depreciation and amortization are left out. Also, unearned revenue like hotel tax subsidies and interest earned on surplus subsidies and/or expensed for debt service are left out. EBITDA as an earnings measure is particularly useful for organizations like convention centers that have large amounts of fixed assets which are normally subject to heavy depreciation charges. What you are left with is a performance statistic showing whether earned revenues can cover and exceed operating expenses and if not, what amount and percentage (in total revenues) of subsidy is necessary.

How Do Most US Convention Centers View Success

The primary measure of success is to attribute convention and tradeshow annual attendance to a healthy hospitality industry where hotel occupancy is high, and out of town dollars spent at hotels, restaurants, entertainment, shopping venues, rental car outlets, etc., all flow on a regular basis. These facts are reported as “economic impact” – a result of event attendee and event organizer spending.  Attendee spending refers to additional expenditure within a city from event‐related visitors such as exhibitors and attendees.  For events, attendee spending forms the major component of economic impact. Collectively, attendee and organizer spending in the host city are directly attributable to event production and is termed direct economic impact.   All cities however, report indirect and induced spending and add this estimate to direct economic impact.  Indirect impact or effects are the changes in sales, income or jobs in sectors within the region that supply goods and services to the hospitality sector. For example, increased sales in transportation to and from airports or linen service companies serving hotels and restaurants resulting from increased business volume is an indirect effect of convention and tradeshow attendee spending. Induced impact or effects are the increased sales within the region from household spending of income earned due to conventions and tradeshows and their supporting sectors. Convention center workers, hotel and restaurant employees spend the income they earn because of conventions and tradeshows on housing, utilities, groceries, clothing and other discretionary spending. Multipliers are applied to capture the size of the indirect and induced effects, expressed as a ratio of total effects to direct effects. Total effects are direct effects plus the secondary (indirect plus induced) effects. A sales multiplier of 2.0, for example, means that for every dollar received directly from a convention or tradeshow attendee, another dollar in sales is created within the region through indirect or induced effects.

To make the economic impacts easier to track, cities have determined through independent research the average spend per event visitor. You will see economic impact explained in various press releases as an annual event attendance figure multiplied by the average attendee spending.  As an example, San Diego Convention Center’s marketing literature shows an annual event attendance of 824,376 with average spending of $1,179. The Impact calculation is close to $1billion.

Should Economic Impact Be the Only Measure of Success?

Achieving favorable and growing economic impact is the primary convention center goal. Those of us in the business appreciate and can parse the sometimes overwhelming impact that’s reported. Many of us know that the impact estimates are heightened and often overplayed. We all know that:

  • There are show managers (typically tradeshows and consumer shows) who exaggerate attendance
  • There are show managers (typically tradeshows and consumer shows) that present inaccuracies regarding the percent of total attendance from out of town.
  • Event attendee spending does not apply to the city or metropolitan region as final demand and there are doubts that the proper calculations actually occur. The basic problem is with retail purchases of goods that are produced outside of the region. Only the retail margin and maybe some portion of wholesale and transportation margins should apply as final demand for the region.

For the most part taxpayers understand direct economic impact. Indirect and induced economic impact is not so easy to follow. If the impacts are substantial the evidence unfolds before them as market forces drive private investment in new hotels, upscale restaurants, and entertainment and shopping districts, all in proximity to the convention center. Adding indirect and induced economic impact without a truly convincing explanation can sometimes be a tough sell. So in answering our own question, “Should Economic Impact Be the Only Measure of Success?” yes, something more is needed. For a convention center, having a goal of improving cash flow, watching as your efforts bear fruit, and eventually achieving positive cash flow measured as EBITDA is as satisfying to convention center leadership, staff, board members, and political supporters as a large economic impact is. Favorable cash flow statements have these attributes:

  • A solid ring of truth about them; they demonstrate management competence.
  • They resonate well with most segments of the population who may be naturally skeptical of unusually large economic impact statistics.
  • They add a legitimacy, believability and clarity to economic impact reporting. Ultimately clarity matters. Clarity leads to public support and unity of effort.


If successive years of positive cash flow are achieved, covering all cash related expenses and accumulating a capital reserve, that fact will provide a reputation lift to the convention center and city and will be regularly reported and indeed celebrated with pride.

Findings –Are Convention Centers Able to Cover Operating Expenses with Earned Revenues?

Some are, and more than you’d think. Some are closer than you’d think. All should at least try.

The research conducted is illustrative. For convention center sample we were able to find and review audited financial reports for the most recent business year (either 2014 or 2015). The sample size was smaller than desired however; many of the financial reports that exist are bundled with other public facilities like theaters, arenas and stadiums. Phone calls to convention centers were not effective; most did not have the information readily available and often ended with suggestions that we file a FOIA request. To conduct a full blown study with a larger sample size and a review of multiple years would be daunting; beyond the process delays of FOIA requests there would probably be many questions as each center has different accounting methods for classifying revenues and expenses. For example, some centers count deferred revenues (rent received for an event which hasn’t yet occurred) as operating revenues while others count it as unearned income. A detailed study would also do a more complete job of explaining why some convention centers do better than others financially as the study reviews and compares occupancy rates, service offerings and their pricing models, and overall expenses.

In general the findings were surprising. Our expectation is that we would only find one or two convention centers in the sample where earned revenues covered or exceeded operating expenses less depreciation. We found six (37.5% of total). We also found convention centers where in our judgment achieving the goal of covering expenses (“operating profitably”) seemed reachable. Given the limits of sample size, the tables below summarize findings. The tables also attempt to benchmark (using averages and medians) the occurrence of “being profitable” in calculating the following; earned revenues, operating expenses (less depreciation) and net – all per gross square foot of exhibit space; dependence on government support (normally from tourist taxes) expressed as an amount and per cent and; documenting which service offerings the convention centers provide.

Sample Convention Center Operating Cash Flows – 2014 or 2015

Issue9-1

NOTES: * WSCC carries all or part of the city’s convention marketing expense of $10.4M. This expense is  normally carried by the CVB   elsewhere. Without this expense WSCC’s cash flow improves substantially. WSCC’s F&B is self op.

** DC Convention Center’s revenue and expenses were derived from DC Auditor’s report 2015.

*** The Javits Center could well be considered an outlier in this comparison. Center has a high client demand, books all its  own business, rarely gives rent concessions and has a full range of high value services including labor provider to General and Exhibit Appt’d contractors

Sample of Convention Center Major Service Offerings

Issue9-2                Issue9-3

Statistical Inferences

  • If the Javits Center is taken out of the analysis as an outlier, then four of the five convention centers that covered expenses with earned revenue had both earned revenue per square foot of exhibit space above average and expense per square foot of exhibit space below average.
  • If the Javits Center is taken out of the analysis as an outlier, then four of the five convention centers offered the high value services of F&B, Utilities (elec. and plumbing), Telcomm/Internet, and Parking
  • Of all the convention centers that covered expenses with earned revenue, four of the six had a known occupancy rate above 65%. There is a strong inference that convention centers with a favorable occupancy rate (over 60%) which offer a full range of high value services (especially utilities) have a much greater probability of covering operating expenses.

Conclusions and Recommendations

  • First let me commit a bit of heresy and say that I disagree with the oft repeated phrase “convention centers are not designed to make a profit”. I consider it one of the more ill advised management declarations in the convention center business. My view as a former GM is that talk like that will discourage creativity and any entrepreneurial spirit your staff may have.
  • The research and findings for this piece are encouraging. There are good examples of cash flow improvement and coverage of operating expenses with earned revenue. One of the better examples is the work of a private convention center management company, AEG Facilities.  They’ve taken the step of thinking and acting strategically in announcing that covering expenses with earned revenue as a primary goal for their clients. They made it policy and they met that goal at the Los Angeles Convention Center for successive years. They have been able to increase occupancy from 55% when they assumed management in Dec. 2013 to 72% currently, a notable turn around. It has been recently reported that for FY 2016 that Los Angeles Convention Center achieved an $8.1M operational surplus. Additionally, similar progress has been made at the Hawaii Convention Center which AEG Facilities also manages. The Los Angeles Convention Center has retained the profits and funded the center’s own capital reserve. It is often surprising how rapidly the fund accumulates cash. At some point a convention center can reach a level of self sufficiency where technical improvements can keep pace with the market and deferred maintenance doesn’t grow out of control. AEG Facilities accomplished this with cost cutting (principally payroll), renegotiating terms, commissions and price schedules for contract services, and aggressively filling open dates with film and photo shoots and consumer shows.
  •  AEG Facilities’ effort will probably represent a change in the way private management companies compete.  Normally private management proposals are strong on cost cutting measures which they can all do consistently well. Rarely is there a stated and clear objective of covering operating expenses with earned revenues in privatization proposals.
  • We reviewed many service order forms and found some meaningful price differences among convention centers in the same region serving the same market sectors. Recommend that a pricing audit be conducted and see how you compare to current market prices. Perhaps you have more pricing power than expected.
  • In several of the audited financial statements there appeared a line item entitled “rent credit”. We learned that this was a way of accounting for rent discounts and rent free events. Rent credits are classified in financial statements as unearned revenue and are, from what we have learned, non-cash revenues, i. e., convention centers do not actually receive a partial or full reimbursement. Some of the credits were substantial. For example, the Los Angeles Convention Center posted 2016 rent credits of $6M. Rent credits occur mostly with association meetings and exhibits. These terms are negotiated by CVBs. This happens whenever there is a ”citywide” event measured by the number of anticipated hotel rooms needed. The usual offer to clients is zero rent. Zero rent became common in the early 2000’s. The dot com bubble had burst, more exhibit space was coming on line and cities were concerned about losing market share. Then 9/11 hit and the recession followed in 2008. Now, zero rent is a common negotiating tactic, especially for professional associations. I believe convention centers are making it too easy for CVBs to offer zero rent on proposals for these reasons:

• It is wrong that one organization crafts transactions that are not particularly
beneficial to the organization that is ultimately accountable.

• Generally competing on price alone diminishes the perception of your city’s
brand and creates an impression that event locations are like commodities;
one is as good as the other. Indeed cities and convention centers are not.
Reasonable price competition can work, but once you start leading with
price, especially zero rent, the expectation is that you will do it all the time.

Challenge CVBs to offer better justification for zero rent. Force them to obtain more corporate intelligence about the client’s real intentions; is coming to your city a real market advantage to the client zero rent or not, for associations – is your city part of a predictable rotation increasing the probability of a booking, are there less costly value added parts of a proposal that all together are as attractive as zero rent. Additionally engage in conversations with the general decorating contractors, hoteliers, board or advisory association members from your city and key exhibitors from your city. This takes hard work and finesse but clear information about location decisions are sometimes revealed.


For convention centers interested in improving cash flow, consider the audit services that MTMConsult, LLC can provide. The audits can be scaled to fit your situation and are reasonably priced. Our team of experienced practitioners with real field experience will drill down to the important details and provide actionable results.

Email us at advisor@conventioncenternow.com  or call – 203-273-6999

Union Labor in US Convention Centers – How to Negotiate a Collective Bargaining Agreement (CBA) that Fits the Convention Center Business Model

An Historical Perspective

The vivid history of struggle for labor unions in Northeastern and Midwest cities left a legacy of distrust and resentment but also a feeling of empowerment as wages, benefits and living standards all improved for union members.  Strong union leadership came to influence and intimidate political leaders.  Reactions to threats such as non-union participation in large construction projects or service workers in urban cores were loud, confrontational and mostly, successfully opposed.  As union membership declined nationally their membership held. Aggressive negotiating tactics and the threat of strikes were modus operandi. These strategies survived later generations of union leadership up to and including the building boom in urban convention centers in the 1980s and 90s.

So it is no coincidence that convention centers could be said to be genetically tied to unions. In the years of new and expanded convention centers, finding financial resources needed to build new was a formidable task.  Political leaders therefore:

  • Dealt with the financial issues by garnering vocal political support and labor unions could always be counted on.
  • Understood that the quid pro quo for union support has been continued employment relating to convention center operations – so many convention centers are born with union labor at their side.
  • Created an environment where convention center management often carried the recognition that unions have political clout, enough to make managers unlikely to push hard for change. Without support, the unreasonable demands and bad habits that unions carried were rarely challenged. Tradeshow contractors through a local trade association negotiated Collective Bargaining Agreements (CBAs) and administered the same to most of the convention center work forces. Their attitude was similar to the convention center management’s – they felt that the unions occupy a stature not easily contested.

We know now that these agreements and how they are managed day to day are a key element to a convention center’s business reputation. If things go badly the convention center and the city suffers damaging publicity, rarely are the trade show contractor’s associations held accountable.  For some cities things did go badly:

  • Detroit’s convention business, already a hard sell in the 1980’s, turned into the lowest occupancy of any major city, largely due to union excess.
  • During the same period in New York City, the leadership position as the city with the biggest and the best shows quickly changed. New York’s problems took on notoriety as organized crime infiltrated the unions. The Javits Center became the worst example of union labor problems – mobbed up, featherbedding to excess, with organized theft on the exhibit floor and loading docks, payroll and insurance fraud and worse.
  • Chicago’s McCormick Place and the Pennsylvania Convention Center in Philadelphia were not far behind.

Union leadership had become the de facto managers of convention centers.

How did this happen? Too often management forfeited control of hiring decisions, production schedules, work rules and nearly everything else that governs an orderly productive work force.  It came to be that event managers insisted that union shop stewards participate in event planning meetings – they knew where the power to set up an event efficiently and peaceably resided. What occurred was a sorry history of appeasement and indulgence to union demands. There was a purposeful and persistent avoidance of confrontation. In sum, there was no will to make things right.

Meanwhile in the convention center boom of 1980s and 90s, centers opened or expanded in “right to work” states of the South where there was lower labor costs and an absence of strong union culture. Quite rapidly the business advantages of southern and western cities became clear and convention centers in the Northeast and Midwest began to lose market share. West coast convention centers which were union buildings, such as the Las Vegas Convention Center, the Sands Convention Center, Moscone Center in San Francisco and the San Diego Convention Center thrived also. One big differentiator was and is that customer service was simply better in the South and West. It was apparent that the hard-edged “us vs. them” union culture wasn’t present – they were and are friendly, polite, reasonable, helpful, with no shop stewards enforcing “rules”. Managers from the large freight and decorating companies have spoken openly about how cooperative labor is in Anaheim, San Jose, San Francisco, San Diego, Phoenix and Las Vegas. Company managers could concentrate more on show production and service. In these cities the union wage and benefits paid were comparable to Chicago and the East coast and the decorating/freight moving contractor’s business model was the same. By most measures New York and Chicago had similar competitive appeal, yet Chicago and New York still lost market share for the best shows.

Customer service and prevailing business expectations of service were something that unions were loath to   understand and accept. Innovative and emerging businesses like information technology or the health sciences were generally non-union companies. They were conscious of the marketing investment required to participate in a tradeshow, convention or conference. Their focus was and is all business, and they were put off when confronted with service that was indifferent, expensive, and often corrupt. Why tolerate this when there were alternatives? It didn’t take long for show managers to move their events to other places. They abandoned traditional market locations in part to save their exhibitors from union labor. But change was in the wind and New York’s Javits Center was first.

The Tipping Point

In the Spring of 1995 we were fortunate to be part of a team that planned and executed taking over all labor contracts at the Javits Center.  Some were held by the NY Exhibition Contractor’s Association. Labor reform was only part of steps taken to turn around Javits Center’s declining business but it was by far the action that sticks in everybody’s memory. It was clear to most that the business decline and sordid reputation had reached a point where the hospitality businesses in the city were primed and ready for something radical to occur.

In the beginning of 1995 press reports about Javits Center mismanagement and presence of organized crime in the work force were common. The points below describe the environment we had going in:

  • We had strong political support. NY State’s new governor at the time, George Pataki, knew of and fully supported our plan
  • Two of the unions were being investigated for corruption and under some type of federal or court mandated supervision.
  • Before contract negotiations began the unions accepted three important conditions; overlapping work jurisdictions were over, there were to be two principal work forces- one for exhibit building and the other for freight moving, and; the Javits Center could hire from any source.

The Javits labor reform plan was executed swiftly. Once launched, in one week’s time there was an entire new work force with the following:

  • No overlapping work jurisdictions or composite crews
  • Hiring requirements administered by the Javits Center covering personal appearance, customer service attitudes and skill
  • New work rules, service, integrity and productivity standards
  • 24 hr, straight time labor, M thru F
  • Apprentices added to the carpentry work force without prescribed ratios to journeymen
  • Broad management rights; management would decide on crew sizes, multiple shifts and flexible start times for carpenters, who would work overtime, etc.

Within one year center occupancy improved from 35-40% to 60-65%.

How to Negotiate a CBA that Fits the Convention Center Business Model

The narrative below focuses on the Javits Center CBAs developed in the mid 1990s as the best example of agreements that were designed specifically to fit the event business. There are no construction work rules, required union referral for labor, special work jurisdictions, supervision and apprentice ratios or double time wages.  It covers all the major sections that should be added or amended from existing CBAs in order to achieve meaningful structural change. The Javits Center agreements and business aftermath did not forfeit any work to others, retained the general administrative management functions for exhibit building (Carpenters) and freight moving (Teamsters) work forces and charged an hourly fee to contractors for hiring them. In their labor reform McCormick Place forfeited electrical services and permitted exhibitors to do a major fraction of exhibit building – perhaps good for show managers and exhibitors but a major loss of revenue for McCormick Place and trade show contractors.  In the Pennsylvania Convention Center’s labor reform, the problems of overlapping jurisdictions and a generally unmanageable carpentry work force were solved to a point. However, there still remains a pending appeal by the carpenter’s union via the state’s public labor regulators.

The Javits Center CBAs are different in that all the CBAs are held by the center.  For contract labor (the work that General Decorating contractors and EACs do), contractors hire from the Javits Center. The center manages the contract, does all the payroll and administrative functions, hires and fires, conducts training, provides uniforms, etc. In most other convention centers the trade show contractors association normally hold the carpentry and freight moving contracts while the convention center holds the utility services contracts.  The advice and counsel given below can be applied to both circumstances.

Preparing for Negotiations

If you’ve experienced union labor problems at convention centers there is a familiar pattern of conditions that evolves. Firstly the CBA is generally modeled after city-wide construction agreements and gives unions too much control:

  • Labor assignments are by union referral only
  • There are jurisdictions within jurisdictions for specialized work all requiring one or more levels of supervision.
  • There are ratio limits for the use of apprentices who are often unavailable.
  • The wage and benefit packages are expensive with benefit loads exceeding 50% of wages.

More harmful to management however are the subtle and insidious ways the union can expand and exercise power and control:

  • Friends and family of union leadership will begin to occupy supervisory and shop steward positions
  • Union stewards will slowly move into making a few then many management decisions over the work force
  • Customer service standards will become secondary; complaints will bubble up; bad publicity will follow and market share will erode.

Our experience is that the local service contractor’s association views organizing for the hard task of a contract dispute or prolonged negotiations too big a business risk. For a convention center, you have reached the tipping point –something structural and meaningful has to happen. If a labor take-over by a convention center is being considered, it will require strong political and business support and a management team that can plan and execute well.

In most circumstances, unless the union side is business-savvy and enlightened, there is likely to be no material or radical change on either side of the table. That is normally the case until there is a compelling reason to change and a resolute desire to change things by the convention center.  Publicized scandal, corruption, and a severely declining business environment are compelling reasons. A well prepared management negotiating team will recognize and exploit these situations. Most of the public believe that negotiations are a series of proposals and counter proposals about wages and benefits, but there are issues equally important to obtaining a favorable CBA. These issues revolve around trade jurisdictions, management rights, and literally all the routine things that control the conduct of work and productivity of the work force. For every fraction of increase agreed to on wages and benefits there should be a comparable fraction taken in order to achieve a more effective level of management control and a diminishment of onerous, non-productive and often silly work rules.

There should be a standard check list to prepare for these negotiations. First and foremost however, you need to have a clear buy – in from the center’s Board of Directors and the politicians that appointed them. Unless the unions are large and sophisticated represented by legal counsel, you can generally rely on them being unprepared. Know the personalities. Mostly unions will send a local business agent to negotiations. That individual will come with one or two key employees, one the shop steward. You should be thoroughly prepared with:

  • Lost business/declining business statistics
  • Customer complaints
  • Samples of bad publicity mentioned in the press
  • Employee statistics; productivity, absenteeism, sick time statistics, workman’s compensation claims, etc.
  • Business facts regarding your competitors
  • Union work rules at competitive convention centers
  • Insist that the unions provide copies of all their CBAs with other employers for maintenance and construction.

Union business agents will normally begin with a series of unreasonable demands and petty complaints. Expect some sermonizing on their part. So be patient, let the drama pass and wait to ask when they will be ready to seriously negotiate. Hold off on submitting company demands as long as you can – let all the unacceptable and unreasonable arguments play out. Stick to your plan and don’t get emotional.

Important CBA Sections

Contract Objective – This section is sometimes ignored as high minded language which no one is likely to use as a basis for dispute. It should contain the usual perfunctory phrases regarding prevention of strikes and lock outs and peaceable settlement of grievances. The language of this section is key however because it sets the foundation of trade union responsibilities and can come up as a management basis for a contract dispute or as a reasonable defense in an arbitration proceeding. The Contract Objective section is the essence of the contract – the union provides enough qualified labor and the employer provides work and pays them fairly. This is no small matter.

Trade Jurisdiction – This is a difficult section and has to artfully written. It’s worthwhile to compose this section as elegantly as possible where a few words and phrases spell out the jurisdictions with clarity. If necessary, difficult ambiguities should be covered in a separate “exceptions” paragraph.

Another item normally covered by the Trade Jurisdiction section is the identification of classifications within a trade (journeyman, apprentice, etc.). Be sparse in any language and phrases, for example, identifying supervision (foreman, leadman, etc.). Quite often by listing all the supervisory classifications, working groups end up with unnecessary and multiple levels of supervision.

Union Recognition – This section normally gives recognition to the union as the exclusive bargaining entity for employees. It’s also a section which can be used to control the activities of union representatives and business agents on your site. It can regulate pre-notification of a site visit, proper credentialing, access, time spent with members, and general conduct on site. Union representatives should not have carte blanche access to your property.

Management Rights – The CBA should in all respects balance employee interests (wages, benefits, overtime, safe working conditions) with employer interests which really involve retention of critical decision making options. On the employer side this is generally achieved by a Management Rights clause. As with the Trade Jurisdiction section, it’s worthwhile to compose this section as elegantly as possible where the words and phrases spell out management rights with clarity.

While we favor the above approach, some legal experts contend that a short list of fundamental rights coupled with all encompassing language is simply not sufficient. Employers want to rely on residual rights. This means that all rights to operate the business are retained except those relinquished by other provisions in the CBA. Legal experts however point to a history and bias of Public Employment Commissions or Authorities where they clearly favor the process of collective bargaining when items such as management rights are vaguely expressed.

Extraordinary Sections to the Management Rights Clause – There are exceptions which require separate mention and emphasis from work rules. At the Javits Center it was accepting gratuities and drug and alcohol testing.

Accepting gratuities has long been cause of much of the industry’s bad reputation. Indeed, convention centers in Detroit, New York, Chicago and Philadelphia have suffered dismal business reputations because this got out of control. Acceptance of a gratuity became a demand in some instances. All cities have largely curbed this abuse but the legacy of bad news is difficult to change. There must be a provision prohibiting acceptance of gratuities and a “no tolerance” standard set, i. e., immediate dismissal. Some cities such as Philadelphia’s separate Customer Satisfaction Agreement or Chicago’s Exhibitor’s Bill of Rights could be considered worthy of separate CBA sections. Drug and Alcohol Testing needs a separate section because it requires a true examination by legal counsel. There are health and personal privacy issues to consider too. Normally authorized testing is permitted on hiring, on a post accident investigation, or when there is strong management suspicion of abuse. Random testing can only normally be done for security workers or fork lift drivers.

Hiring – An ideal “Hiring” section should include the following:

  • A provision giving the Employer the right to hire from any available source. This will be aggressively contested but is necessary. Most of the union problems are rooted in a clique of union members who have a strong loyalty to the union and will cooperate with things like customer service initiatives only in the most superficial way. The employer should not be limited by bad choices. Establishment of a probationary period for new employees for a time (1 year is best) after hiring. These probationary employees can be discharged at any time and the discharge not subject to grievance procedures.
  • Include a provision which permits a reduction in force. Probationary employees will be first and all others by work performance. If employees are regarded as equal performers, then date of hire will govern.
  • The reduction in force provision is often regarded as the “seniority clause”. Certain unions, particularly the Teamsters (IBT), will attach a system for work calls based on date of hire language in this provision. Once established, productivity normally declines and rank and file workers regard themselves as protected. It’s normally not possible to negotiate this out of a CBA with IBT. Interpretations of seniority are the most frequent cause of IBT grievances. At this point a whole new series of work rules have to be established in order for the Employer to properly control the abuses which accompany work call seniority.

Joint Employer – This section is necessary if the CBA is held by the convention center. It permits others; decorating and drayage contractors, exhibiting companies, and EACs to supervise your employees. To avoid a challenge to the Joint Employer clause, there are some employer obligations that have to be fulfilled. There are some well established and uncomplicated legal tests regarding the a convention center’s level of participation in actually managing and administering the workforce which should clear up and legitimize a convention center holding the CBAs.

Hours, Holidays and Overtime Pay – This section contains the most meaningful terms and greatly affects a convention center’s ability to increase business volume and maximize occupancy. Prolonged event move ins and move outs result in lost opportunity. Event managers will do whatever they can to help their exhibitors avoid overtime and double time. They will even threaten to hold the event elsewhere when the move in and out schedule cannot accommodate their demand for “straight time” move ins and outs. To that end, this section should have provisions covering management’s right to organize multiple shifts, ST wages for the 1st eight hours of work (M-F), one and one half time wages for Saturdays, Sundays and holidays , a training day rate less than ST and several more.

Wages and Benefits – Always controversial, many trade union agreements mirror the wage/benefit package that skilled trades receive in the construction industry. This applies mostly to electricians, carpenters and plumbers. The benefit load sometimes exceeds 50% of the wages. This developed because the unions argued that the construction industry regularly experienced ups and downs. The benefit load therefore had to be high in order to help membership through prolonged periods of unemployment. Unions historically and aggressively insisted that the same package apply to trade show and convention workers and were successful. This is a cause for competitive problems – work forces in non-union or right to work states have much lower labor rates. None of their compensation packages are close to those seen in New York, Boston, Chicago or West coast cities.

The most reasonable expectation is to negotiate against benefit funds that clearly only benefit construction workers or funds that have no material purpose, such as a labor/management cooperation fund. Another benefit fund which may have some prospect of reduction is health insurance funds. As Employers you probably over- pay because many union members must meet or exceed a certain number of work hours per quarter in order to be eligible. Of course many union members do not meet the minimum time required to be eligible, yet as employers you paid the benefit.

Grievance and Arbitration Procedures – Insist on rigid administrative procedures (union responsibility) with respect to timing, meetings and written documentation. Make certain that if these procedures are neglected and not followed, then the grievance is deemed waived. Choose an arbitration organization which does not rapidly move towards arbitration hearings. The longer the process the more favorable it is for the Employer. Most grievances are frivolous and are direct challenges to management rights. Unions have the expectation that the Employer always wants to avoid arbitration and will move towards a negotiated settlement instead. In the long run, a prolonged measured process works best. The point is that union administration is not disciplined enough to meet the filing standards for grievances where deadlines must be met with proper documentation and formats. This is cause to have the grievance dismissed without going to arbitration. The lengthy process is another administrative burden which some unions simply don’t have the time and patience for. They generally lose their enthusiasm for the grievance cause after a long wait.

No Strike, No Lock Out – Spell out all the variations of a work slowdown; sick out, an apparent slowdown measured (in %) loss of productivity, unprecedented malingering, etc.

Past Practices – Be very specific that the employer will adhere to the express terms of the CBA and not be bound by past practices.

Other Sections – Miscellaneous (examples):

Shop stewards – All should be working stewards. Outline conduct and work routine of shop Safety rules and equipment must be adhered to at all times.

Cell phones, ear buds, I-Pods cannot be used during work

An Afterword

If you are successful and obtain some or most of the above recommendations in the executed CBA language, then naturally your management team will have to consistently administer the contract in order to make it useful and effective for your business. This is much easier said than done. It requires a structure of policies, rules, enforcement measures, and training. Then the hardest task of all, it demands no compromise. You would be surprised how swiftly a well negotiated CBA can erode by avoiding stressful situations when the appropriate action is to do the opposite, by unwittingly giving the union management responsibilities like asking the shop steward to choose and obtain extra workers, by deciding not to arbitrate against a grievance regarding a work rule because you may lose or the legal costs are too high. The long term cumulative effect of these and other lapses makes the hard work of negotiating futile. Know this – when you take on the responsibilities as a signatory to the CBA, you own that work force and all the responsibilities which are not only expressed but also implied.

NOTE: Contributing to this article was Andy Peterson. Andy is a Senior Partner at the law firm Jackson Lewis, PC. Andy was the Javits Center’s outside labor counsel in 1995 and was the architect of the center’s original Collective Bargaining Agreements. Andy is still a legal advisor on union labor matters to the Javits Center.


How Can We Help?

Reorganizing and negotiating CBAs that better fit and contribute to your business model can be a formidable task for those who have not been through the process. We can provide experienced advice and counsel and help steer your center’s efforts in re-negotiating your CBAs. Call 203-273-6999 or email mmcgrane@conventioncenternow.com

A Primer on International Association Conferences and Events – Who They Are, What Countries and Cities They Select as Event Locations and, How Do They Conduct Business

As part of my consulting practice I either subscribe to newsletters regarding the convention and meetings industry or receive news alerts on related subjects. There are many, and hardly a week goes by when there is not one or more press releases celebrating a city’s booking of an important international event. These are not usual press releases but often newspaper and business journal articles. The articles are all very upbeat as if the city convention bureau had just won a lucrative piece of international business in a very competitive contest.  Articles usually conclude with a statement validating the city’s status and place in the world as an international city.

What Are International Association Events?

Market Definition and Size – For this article International association meetings and conferences are owned and operated by not-for profit professional associations. Some of the international event names may sound familiar to you:

  • The World Congress of Surgery
  • Congress of the World Federation of Physical Therapy
  • World Diabetes Congress
  • Parliament of the World’s Religions
  • World Conference on Lung Cancer
  • World  Parkinson’s Congress

These associations are recognized as “international” and vetted by the Union of International Associations (UIA). They are carried by the Yearbook of International Organizations (a UIA publication). UIA defines the events or meetings as such:

Meetings taken into consideration include those organized and/or sponsored by the international organizations which appear in the Yearbook of International Organizations and in the International Congress Calendar, i.e. the sittings of their principal organs, congresses, conventions, symposia, regional sessions grouping several countries, as well as some national meetings with international participation organized by national branches of international associations.

In their report, UIA’s international event numbers for 2014 were 12,350. The events in 2014 would play in one of 178 countries and 1,449 cities. The top ten countries and cities for 2015 are shown below:

issue7-1

issue7-2

UIA’s annual International Meetings Statistics Report 57th edition – June 2016 categorizes the events using statistics such as:

  • Whether the event is “ organized or sponsored by “international organizations”, i.e. international  non-governmental organizations (INGOs) and intergovernmental organizations (IGOs) that are included in the UIA’s Yearbook of International Organizations and whose details are subject to systematic collection and updates on an annual basis by the UIA”
  • Dates and Location
  • Size (expressed as number of participants or attendees)
  • Percentage of international attendees (40% minimum).

The last bullet above is important because it is the basis for establishing value when compared to domestic events. UIA also maintains a history of each event’s location back to 2001. This date range of event history is essential for determining predictable rotation patterns and calculating probabilities for successful bookings. The only shortcoming we find in the UIA material is that some events are in fact regional. An example is an international association which is in fact a European only association. Their annual conferences will never occur in Asia, Africa, Australia or the Americas. Therefore the UIA summary statistics related to international events not limited to regions are probably overstated.

There are other association and event directories such as the International Convention Centre Association (ICCA). In comparing to UIA there are big differences which we believe are related to the definition of international association events. For our purposes the UIA statistics are the most comprehensive and reliable directory of international events. Clearly any CVB or convention center pursuing events in this market would have to research and drill down in order to eliminate the improbable and focus on the possible. We believe UIA can provide this information. Their research findings and data base is available for a fee (about $1,500). You can also have research available on a continuous basis for a subscriber fee.


Bookings for International Events Comparing North American Cities to the Rest of the World

Without purchasing or referencing UIA’s publications, we were able to find some useful directories which show how competitive North American cities are in booking international events. In this instance we found some timely statistics in two sources:

  • The OMICS International Conferences website https://www.omicsonline.org/international-scientific-conferences/ . OMICS International organizes as many as 1,000 International Science conferences. These conferences attract world renowned personalities, scientists, entrepreneurs, budding scientists, students and policy makers. OMICS International organizes Science Congress, World Summits, and International science conferences in India, USA, Dubai, Australia and Europe. OMICS also publishes scientific journals for some of the international associations.

The tables below show the number and percentage for individual countries and cities for international scientific, medical and health science and engineering  conferences produced in 2016 (later half) and 2017. There are no social or behavioral science events listed. These type events are the most prestigious of international conferences. Overall there are 933 events combined from both sources.


issue7-3

issue7-4

The data in the tables above, because they represent such a small amount of years, lack strong statistical validity and don’t compare with the long term, more comprehensive data that could be obtained by consulting UIA’s data base and research files. The tables above are useful and interesting because they infer how strong the US is in the scientific fields as well as showing destination appeal for the US and certain US cities.

What Criteria Do these Associations Consider in Making Event Location and Venue Decisions?

In many respects the criteria are similar to the criteria used for a tradeshow or domestic association meeting. There are however differences especially the priority of certain criteria. From the literature and case studies we researched, these are the principal and secondary criteria that are evaluated in making event location decisions:

  • Air Transport Accessibility
    • Direct flights from major centrally located cities
    • Cost, Frequency and Duration of Flights – Includes information of necessary connecting flights
    • Administrative Barriers – Visa and customs issues
  • Local Support
    • Welcoming assistance from the local association chapter and other prominent like-professionals and academics. Some cities have gone much further than an opportunistic one-off effort. The term “Ambassador Program” has taken hold. It is defined as a loose association of community leaders in advanced industries and scientific fields used to attract conventions in their specific field. This type of collaboration has been around for many years but in the past few years destinations around the world are now developing the concept more strategically and aggressively. Many European cities have well developed Ambassador Organizations. Washington DC and Vancouver have initiated similar programs and report that they are already yielding success. This program also assumes networking possibilities with local industry leaders.
    • Planning, logistic and marketing support from the city CVB
  • Subventions (subsidies)
    • Perhaps this should be listed first. Those operators in CVBs and convention centers to whom I have spoken with agree that this decision making criteria is the most important. Typical subventions are; meeting venue rent free, free hotel accommodations and meals for association leadership, direct subsidy for marketing and other general expenses, a hosted reception and dinner provided by the hosting city or institution ( a research university is a good example), loans for marketing before registration fees are received,  arranged excursions for city tourist sites and venues and shopping.
  • Meeting facilities
    • Number, size and configuration of meeting rooms
    • Appearance of the meeting rooms
    • Special services – Advanced A/V, simultaneous translation systems, F&B catering quality
    • Advanced communications – Broadband services (WiFi), reliable cell service
    • Customer service by venue staff
  • Other
    • The novelty and cultural uniqueness of the city
    • Safety and security of the city
    • A pleasant climate
    • Hotel proximity to meeting venue
    • Profitability – At some point the international association is going to take a serious look at how profitable the event would be at a given location. This process and evaluation would take place after a review of proposals.
    • Association promotion – The association’s main interest is whether the chosen location would add credibility and prestige to the association and build membership.

Clearly any CVB or convention center pursuing events in this market would have to research and drill down in order to eliminate the improbable and focus on the possible. We believe UIA can provide this information. Their research findings and data base is available for a fee (about $1,500). You can also have research available on a continuous basis for a subscriber fee.

Determining the Economic Value of an International Event

  • Direct Spending
    Determining economic value is becoming more reliable over the past few years. For cities such as Las Vegas this data is fundamental – so much of the economy depends on it.  Also the due diligence required to finance the substantial physical infrastructure projects (airports improvements, public assembly venues, streets and transportation, general civic improvements) demands it. Most cities have an established direct spending figure for trade shows and convention visitors. The figure is derived from surveys and interviews of out-of-town visitors. No city conducts this research in as timely and comprehensive fashion as Las Vegas.For this brief analysis the percentage difference between a foreign and domestic visitor as reported in Las Vegas will be applied. In Las Vegas the percent difference in direct spending is as follows:

issue7-5

The cause for higher International visitor spending is that they stay longer (about 1 day longer, 4.3 vs. 3.3 days) and they spend more. For example, an international visitor spends more than 100% on food and beverages, 250% more shopping and about 50% on entertainment (live shows). One outlier on visitor spending in Las Vegas which doesn’t exist in most US cities is gambling.

The suggestion here is that this or a similar percentage increase be applied when evaluating the value of international events. That is of course unless your city has conducted its own research. Las Vegas is in all cases a good reference check for spending differences and for research methods. Most cities will go on to parse and apply other economic benefits such as indirect spending, tax revenues, or service job creation to arrive at an overall impact number.

  • The Prestige Factor
    This factor is crucial for cities just developing or improving their tourism economy. International conference, congress and convention goers are business tourists. This adds a gravitas feature to the whole tourism sector. It gives an opportunity for the city and country to show off their airports, urban infrastructure as well as their hospitality sector – hotels, resorts, restaurants, conference and convention facilities, etc. In our research we found this to be often a national cause. Ireland, Cyprus, Malaysia and Korea’s national tourism branches of government all provide generous contributions to their cities and venues to use as subventions in order to attract international events. In sum, hosting international events fulfills national policy aims for recognition as a place to for global business. Global engagement is serious business.For US cities the prestige factor is present but not so pronounced. Some cities have been organized well and have succeeded in capturing a good fraction of the international events market – Chicago, Atlanta, San Antonio, Las Vegas and Philadelphia. For others the industrial sector of an international event may represent a vertical market that represents the city’s economic base. In this respect international events can contribute to economic development of an emerging knowledge based industry.


If you’re Going to Pursue International Conferences, then……..

  •  Do Proper Research First
    •  Understand that you’re entering a global competition with many more competitors, some with a great deal of experience. Know that your probability of booking success will be very low at first.
    • Look for events with recognizable rotation patterns. See when they rotate to the US and learn where in the US they’ve played before. Be careful of associations that have no pattern but choose locations at random.
    • Find what fits – airport/travel scheduling and issues, dates, space, space configurations, sector affinity with your city. The preferred venues are hotels. The cozy, more intimate surroundings are preferable to convention centers. Also, international events tend to be smaller than domestic.
    • Do the math. Prepare some simulations. Use actual attendance data from 5 or more international conferences and calculate the economic impact of the event. Make certain that your estimate of international attendees seems reasonable. Highlight the value added for international attendees.
    • Don’t expect large crowds. Yes, there are some with recorded attendance of 10,000 up to 18,000. These events are not the norm however. They are mostly well under 5,000 attendees.
  • If Your Intention Is to Pursue International Events at Full Bore, You Will Have to Add to Staff and Increase Certain Expenses
    •  Staff will most likely include a sales manager and assistant, a research manager and an office administrator. You could possibly contract out the research function.
    • Expenses besides salary will have to include separate T&E, higher than for domestic bookings, print and graphic services, and a promotional fund to fulfill subventions. About two years ago Washington DC organized to pursue international events. They staffed up in the fashion described above and went to work. In four years the economic impact from international events went from $2.5M in 2011 to $25.5M in 2015.
    • If this seems too much or even unnecessary, perhaps a better strategy is to be selective and pursue only the most profitable and economically favorable international events
  •  Be Prepared for a Heavy Work Load
    •  Canvassing and pursuing eligibility for RFPs is time consuming and can be expensive. Click on the link to view an RFP for an international event – The World Federation of the Deaf. https://www.wfdeaf.org/wp-content/uploads/2014/07/WFDConf_2017.pdf
    • Preparing your proposal and negotiating until closing is also time consuming and expensive. As an example, click on the link for Barcelona’s proposal for The Conference of The International Biometric Society – http://www.biometricsociety.org/wp-content/uploads/2014/03/ibs-2018-bid.pdf . This conference only has about 1,200 attendees.
    • Organizing, maintaining and nurturing the Ambassador group, which appears to be a prerequisite for competing, takes a great deal of relationship building and persuasion. Your sales and marketing team will ultimately end up managing the group and acting as their administrative arm. Your team will at times perform most of the functions that a domestic trade show or convention management company would.
  •  Be Thoughtful about How You Will Deal with Subventions
    •  You won’t be subsidized by the federal government but in order to get a start in the market you may have to agree to subventions you would normally avoid. For small events the subventions are hard to justify. If your occupancy is high and the domestic event market filled with opportunities, then there is no compelling need to agree to expensive subventions. It would be best todisclosethis before entering a competitive bid. Rather, emphasize subventions which can be classifiedasvalue added and steer away from a straight cash subsidy.
    • An interesting study of subventions was done by a consulting group in the UK in 2011. The report shows how subventions are material to location decisions and how they affect the competition for international events. You should click on the link below, download and read the report:
    •  http://www.businessvisitsandeventspartnership.com/news/bvep-press-releases/112-bvep-launch-report-into-global-subvention-practices
    •  The chart below is from the report and is a summary (although dated) of city practices regarding subventions. It’s a good quick reference.

issue7-6


Providing Air Conditioning and Heat on Exhibit Floors during Event Move In

This is a troublesome issue and always has been. Most recently the subject found itself on the agenda for an annual SISO meeting. My first impression was that SISO would take a policy stand, making it a critical customer service issue and pressing that air conditioning during move in should be provided at no charge. After a brief discussion with SISO leadership I learned that there is no formal SISO policy announcement and that there was true recognition and appreciation for a convention center’s high utility and operating costs.

Convention center designers have never really addressed this problem seriously or more likely, measures to make the event move in environment more tolerable were value engineered out of the project. The problem is generally widespread throughout the country from humidity prone, to bitter cold, to desert heat regions alike.

Why Is this Issue?  It Seems Small Compared to All that Matters

  • Excessive Heat and Humidity or Cold During Move In Is a Serious Customer Service Problem
    Exhibitors face many challenges during event move in; anticipating freight arrival, exhibit construction, testing equipment, final rehearsals, etc. Adding the annoyance of excessively hot or cold and uncomfortable conditions is poor customer service.
  • Providing Air Conditioning During Move In Is Very Expensive During the Summer
    Commercial electrical rate schedules are higher for summer months. In New York City for example peak months are June through September. Along with peak months there are peak hours. Utilities call this time of day rates covering daytime periods generally 8AM to 4 or 6PM, Monday through Friday (weekday holidays normally excluded). These rates .for electrical consumption (KWH) can be 30% -50% higher than non-peak hours.Electrical demand rates are also applied in the same manner as consumption. Depending on where you’re located, commercial demand rates can be 60% to more than 100% higher than demand rates during non-peak months.

Examples:

  1. (Atlanta) Georgia Power – Large Commercial Rates – Summer TOD 

    Assume air conditioning requires 4,000 Tons of refrigeration for 500,000 gross square feet of exhibition space on a weekday in July

                    Consumption (KWH): 4,000 Tons x 1.5 KW/Ton = 6,000 KW
6,000 KW x 10 hours = 60,000 KWH
60,000 KWH x $.07264/KWH = $4,358/Day

                    Demand (KW): 6,000 KW x $10.43/KW = $62,580*

                    Total Cost per Day: $4,358 + $62,580 = $66,938

*Demand charges only apply if the day’s demand (in a 15 or 30 minute interval) is
the highest for the monthly billing period. Fuel adjustment charges not in
calculations

  1. (New York City) NYPA and ConEd – NYPA for consumption or KWH purchased through the open market (NY is a de-regulated state). Con ED for distribution charges (demand) 

    Assume air conditioning requires 4,000 Tons of refrigeration for 500,000 gross square feet of exhibition space on a weekday in July 

    Consumption (KWH): 5,000 Tons x 1.5 KW/Ton = 6,000 KW
    6,000 KW x 10 hours = 60,000 KWH
    60,000 KWH x $.08/KWH = $4,800/Day 

    Demand (KW): 6,000 KW x $23.04/KW = $138,240* 

    Total Cost per Day: $4,800 + $138,240 = $143,040

             *Demand charges only apply if the day’s demand (in a 15 or 30 minute interval)
is the highest for    the monthly billing period. Taxes and fuel adjustment
charges not in calculations

The rates from Atlanta are relatively low. New York City rates are among the highest in the country. If anything, the above proves that air conditioning during move in days is no small matter. For show managers, paying for electrical consumption during move in is reasonable, paying for demand is not. In my time at the Javits Center I have seen monthly demand charges exceed $250,000. That was for a full building show (over 800,000 gross square feet, in August).  Convention center should never permit a move in day to become the highest day of the billing period for electric demand when it could be avoided.

  • Most Show Managers Can Understand the Economics of Peak Hour Costs for Electrical Consumption But Not So for Electrical Demand 

    Most annual convention center budgets have forecasted and factored in summer electrical demand charges. Facility managers know that there are not many opportunities for demand reduction measures like shedding loads as demand rises after the event begins. Seizing an opportunity to reduce summer demand charges therefore should not be missed. Imagine being in a situation where the move in day is hot and humid but the overnight forecast calls for a cool dry air mass for the event days. Imagine being in a situation where the move in day is on a Friday in July and the event is scheduled for a three day weekend with Monday as a holiday – no demand charges.  The monthly savings can be substantial. From time to time an issue may arise where at the last minute a show manager asks for air conditioning on a move in day well after peak hour pricing has begun. Facility managers do not want to start a central plant (chillers, pumps, air handlers, etc.) during peak hours. Doing so puts you at risk that a move in day will become the maximum billing day for demand that month, the savings opportunity lost. Chiller plants normally draw a lot of demand as they approach the chilled water set point. After they reach that point, demand generally diminishes. In this circumstance you would have to provide less than 100%.

Recommended Best Practices

  • Unless there are special circumstances you are advised not to provide air conditioning or heat during move in to event management at no charge. Most centers do charge. Some such as Mandalay Bay and the Mirage Convention Centers in Las Vegas provide air conditioning at no charge for the last event move in day. Some of you to whom I have spoken with say that at their center this matter is purposely left flexible. That may be a useful internal policy but it should be kept confidential, because the opposite is likely to happen, it won’t be flexible. Show managers are tough negotiators; they will sense an opportunity and persuade you to absorb the cost. There should be a clear written policy for charging for air conditioning and heat on move in days
  • Do not make air conditioning and heat during move in part of the rent. Too often rent is negotiated down in order to maintain and improve market share or to accommodate a large event where the overall economic impact is very high. Also, there are circumstances where temperature and humidity ranges need to be controlled during move in. A commercial produce show is an example. Air conditioning charges during move in should be specified as a separate item in the license agreement,
  • Make the charges for air conditioning and heat during move ins fair, enough to cover consumption charges from utilities,
  • Always supply some air conditioning, say 15% with exhaust fans and a few supply fans at no charge. Set a floor temperature goal of the low to mid 80’s for floor temperatures. For heating, do likewise and supply heat from air handlers adjacent to outside freight doors at no charge.
  • Take steps to manage demand on your own:
    • If the show manager won’t purchase air conditioning for move in days when high heat and humidity are forecast, pre-cool the space several hours before the move in starts and when non-peak rates are in effect. Keep the freight doors closed, close outside air dampers as no fresh air is necessary until the space is occupied. Then just before peak rates apply, reduce most of the air conditioning operations and follow the practices from the bullet above.ASHRAE has written a few white papers on pre-cooling. Below is an excerpt:

      Night precooking involves the circulation of cool air within a building during the nighttime hours with the intent of cooling the structure. The cooled structure is then able to serve as a heat sink during the daytime hours, reducing the mechanical cooling required. The naturally occurring thermal storage capacity of the building is thereby utilized to smooth the load curve and for potential energy savings.

      My experience is that this works for about 5 or 6 hours. Some level of air conditioning will may have to be left on.

    • If show management elects to purchase air conditioning for move in days, then pre-cool as outlined above only earlier. Do not commit to a floor temperature in the low to mid 70’s, the high 70’s and low 80’s are more achievable. On hot humid days this will also prevent ceiling drips from pipe and ductwork condensation. Pre-cooling should wash the humidity out of the building and provide positive pressure throughout. This should work to control electric demand. This should be done along with the items below regarding doors.
    • Exercise strict control over the freight doors. Close those that are not being well used. You should find most general decorating companies cooperative.
    • Consider transparent weather strips at the most used doors. They are an inexpensive fix but usually need to be changed frequently to maintain good visibility.
  • Investments that Work
    • The Washington DC Convention Center normally does not charge for air conditioning during move in days. To control costs they have converted their freight doors into “speed doors”
    • Washington has also connected one or two of their large chillers to an on-site generator. They can elect to air condition exhibit floors using their own power, avoiding peak hour consumption and demand costs.
    • Some may say that air curtains work but my experience has been that the large ones for freight doors are too drafty and noisy
    • Years ago designers at Cobo Hall designed a transition space between the loading dock doors and the exhibit floor. The barrier of a demising wall and inline freight doors helps temperature control on the exhibit floor.
    • In the 1990’s McCormick Place made a major investment in chilled water storage, producing chilled water at night and circulating it for a full days use. They also supply chilled water to other customers beyond the convention center. McCormick also uses Lake Michigan water for condenser water, no cooling towers.

9/11 at the Javits Center

Last week marked 15 years. We know now that the attack wasn’t just a one-time thing and now all convention centers have legitimate concerns about terrorism during an event. The Javits Center was a few miles from the attack but we had a view of the planes hitting and the WTC towers falling. The Javits Center did play a role in the aftermath, providing logistical support to the rescue, recovery and security teams. I believe we were able to use our assets effectively and in a small way contribute to the recovery effort.

The account below was written by me 6 years ago.

M. McGrane

Over the years many have asked if we could write an account of what happened to us that day. Our experience was insignificant compared to the events of that day, but perhaps there’s some lessons learned here if not an interesting story.

We had four events in the house that day; a large merchandise show on the lower level to open at 9AM, a store fixture and display show on the main level to open at 9:30AM, a commercial flower show also on the main level for the second move in day, and set up for a product roll out for an office technology company on the upper level. After the first plane hit at 8:45 AM the AGM called and told me he had a bad feeling about it, no one flies into the side of the World Trade Center on a bright clear day.  Neither the local news nor CNN which was being broadcast on all public monitors had any news on the real cause. The AGM called again and insisted that I go up to the Crystal Palace and view what was occurring downtown and in the center itself. I was at the base of the escalator to the Crystal Palace at 9:03 AM.  The view from the Javits Center had the two Trade Center towers overlapping so, if you weren’t familiar, it may appear as one large building. The second plane hit. The horizontal plume of flame and smoke made it look as if this was a secondary explosion from the first plane. CNN quickly corrected that. Both towers were aflame.

A quick meeting with all the show managers was assembled and we informed them that we were shutting down the loading docks and that there would be controlled access through the front entrances – attendees would have to go through designated doors under the view of Javits Security and State Police. There would be random checks of handbags and brief cases. We set a meeting time for 30 minutes later or sooner if we obtained any information. There were few questions and no one complained. Although unsaid, I believe everyone in the meeting had the sense that something menacing and ominous was going on downtown. It was about 9:20 AM.

Internal staff met for a time to organize radio procedures and to review evacuation plans. There was still no official word from the State Police about what was happening. All news came from CNN. We had arranged the show floor plans and compared them to the evacuation routes just before we made our way to the next information meeting with the show managers when CNN reported that the Pentagon had been hit. It was about 9:45 AM.

The big decisions were easy now and the meeting was brief. We would evacuate the center immediately; exhibitors, attendees and contractors were to follow the directions of Javits Security and the State Police since due to the loading dock closure some of the routes had changed. We would meet with show managers again as soon as practical. Everyone nodded in consent and the meeting ended. At 10:05 AM the South Tower collapsed and we saw everything disappear in an enormous cloud of dust. By 10:15 AM the Javits Center was evacuated. We estimate there were between 5,000 to 6,000 people. Then, at 10:28 AM the North Tower collapsed.

In the following hour tidbits of news and rumors came and went. We had a short lived moment of panic when news came down that the bridges and tunnels were likely targets too. The south tube of the Lincoln Tunnel was 25 feet below Hall 1A. The State Police quickly communicated with Port Authority Police and we learned that the Tunnel was evacuated and inspected. We were safe. Staff was dismissed and key people were selected to remain. Many volunteered to stay. At 11:02, the mayor ordered the evacuation of Lower Manhattan. What was happening was unbelievable.

At about noon, city emergency service personnel arrived and asked for help. They were covered in dust and soot. The only clean part of their faces was inside the outline of the face masks that they had been wearing. They needed to set up a triage center and a field hospital as soon as possible. While we explored the internet for plans, building maintenance staff quickly began to set up portable utilities, lighting and furnishings in the North Pavilion. Within the hour a medical team arrived. They left shortly afterward and headed off downtown. The casualties and injured would be handled closer to the WTC site. At about 1 PM one of our managers called me up to the South roof. The scene was like a war movie. A stream of people as far South as I could see were walking North on 12th Ave. From the heights they appeared as a ribbon of refugees fleeing a city under siege. The cloud of smoke from the World Trade Center was behind them.

The remainder of the day saw emergency crews arrive at Javits. At one point in order to create more space, the remaining managers and maintenance personnel took forklifts and hand trucks to move out the partially installed exhibit booths from the commercial flower show on the main level. Emergency crews came from New Jersey, that evening teams of “smoke jumpers” arrived from out West, teams of rescue dogs and their handlers arrived from all across the country and Canada, a large contingent of New York State Troopers arrived and finally the New York State National Guard. Our team set out utilities; electric, phone lines, internet lines, portable showers, etc., etc. Centerplate’s GM was busy too. That evening he prepared over 300 chicken and rice dinners. He had sent all his employees home and did this all by himself.

The next few days were like a blur. Rescue teams came and went. Javits became the storehouse for supplies, lots of bottled water and pet supplies for the dogs. We were announced as the rallying point for volunteers and they came by the thousands; tradesmen carrying tools, doctors carrying their medical kits, even a few crazies. The only volunteers needed that I recall were operating room nurses and welders trained for work in confined spaces. The President arrived one day to meet with the families of the dead and missing. A planned 1 hour visit became a 5 hour visit.

We learned that nothing can replace a well trained team of managers and skilled workers. We learned how invaluable it is to have permanently stationed police on site. It gives your actions in an emergency a strong sense of legitimacy. Convention center designers should remember that. We learned that convention centers because of their scale, large spaces, utility capacity and access are logical places to use when there’s a general emergency.  I know it sounds trite because it’s so often said, but we learned that people really do rise to the occasion when necessary and with a spirit I hadn’t seen before. We learned that trouble creates its own capacity to handle it.

God Bless America.

Starting and Expanding Advertising and Sponsorships as a Revenue Stream

Why Is this a Good Idea?

I have often been confused why more convention centers do not actively engage in an advertising and sponsorship program as a revenue stream. Perhaps it’s viewed as a business more appropriate for others; sports and entertainment venues are the logical setting for advertising and sponsorships, not convention centers. Sports stadiums and arenas and their tenant teams – football, baseball, basketball, hockey, etc., all have a loyal fan base and fans are very emotionally connected. Television and radio coverage are integral parts of the sports experience. These things don’t exist at convention centers and convention center management may not feel it’s worth the effort. I also believe there’s reluctance by some convention center management to use ad space and media that were once exclusive domain of event managers and then, charge fees and commissions for features that were once free.

My belief is that if convention centers who feel this way would conduct a thoughtful evaluation of the benefits and risks, they may change their minds.

Benefits – A well crafted ad and sponsorship program:

  • Contributes a level of legitimacy with respect to the convention center being a place of business, where new products and services are rolled out and demonstrated in a setting where comparisons can be made, where deals are done, where technical and scientific information exchanged, and where like minded professionals can network and socialize.
  • Strengthens the business relationships with others in the city hospitality sector. Restaurants, hotels, nightclubs, shopping districts, and other cultural and entertainment venues are likely advertising and sponsorship candidates. Having the relationship solidified by an advertising agreement helps achieve that. The character of the relationship would be different; it won’t be casual or shallow anymore, it will now be business.
  • Can become a reliable revenue source which may waver up and down with the vagaries of the economy but can grow in stable and growth years. There are a few convention centers where an advertising and sponsorship program has contributed between $1 – 2 million to the bottom line annually.

Risks

  • Know that many times brands are judged by the company they keep; remember this, it will come up again. Many times an advertiser or sponsor’s business issues, such as product problems, legal issues, and financial problems become your problems. This is especially true if it’s a naming rights sponsor. Choose potential advertisers and sponsors wisely. Understand that advertisers and especially sponsors may view the convention center similarly. Convention centers are accountable to them for bad publicity and for routine items such as signage and website maintenance, or for the overall condition of the facility. Sponsors too will always be interested in their return on investment and review the returns periodically.
  • An overly aggressive ad and sponsorship program can pose some problems with your trade show and association meeting clients; too much signage by advertisers takes away from space available for an event’s trade dress signage and decoration and their own sponsor advertising, inflexible terms regarding advertising and product exclusivity by sponsors may interfere with an events’ exhibitors or their sponsorship sales. Also, critics may argue that over-commercialization with garish signage and endless brand messaging detracts from the convention center’s mission. It’s best to exercise good taste and a sense of propriety here.
  • An advertising and sponsorship program is very visible to others and potential event clients. An ineffective and feeble program where advertisers and sponsors are few detracts from the center’s reputation. If, after evaluation, you do not believe you can achieve revenue goals and visibility then perhaps you should forego the effort.

Taking Stock – What Is Your Inventory of Advertising Possibilities and Media?

Exterior

  • The Center’s Location – Is it located by and in view of major traffic thoroughfares? If so, call the municipality and obtain a daily traffic count. Pedestrian counts may also be available.
  • The Center’s Architecture – Normally the entrance is a piece of landmark architecture. The curtain walls are high, there is usually an array of light or flag poles along the entrance drive, and the adjacent sidewalks are wide. All are possibilities for banners and signage.
  • Fixed Static or LED Signage (usually located by the center’s entrance) – These signs normally announce the event(s) in-house, but have fixed signage possibilities as part of the sign structure or in the case of an LED sign, use possibilities due to the technology.

Interior

  • Center entrance, atrium, lobbies and concourses – All have high curtain walls and space frame features for banner hanging
  • Well trafficked corridors – Recommend a limited number of high quality back-lit signage
  • Center video screens – Large video screens are best located in the expansive entranceways, atriums and lobbies where the scale fits the setting. Smaller video screens are more appropriately located along well trafficked corridors, retail areas, taxi/shuttle bus waiting areas and food courts. The screens are normally part of a network, complete with a control room, equipment room and the capability of running different messaging (pre-programmed) for each screen.
  • Columns in atrium and lobbies
  • Public stair risers – Normally temporary and done with 3M product with adhesive back
  • Escalator side panels and railings
  • Taut cables over escalator wells for banner hanging
  • Displays adjacent to Information and Concierge Stations
  • Ads and wraps at water coolers and phone/tablet charging stations
  • Food Court table tops – Using the same adhesive backed 3M product

Digital/Print –

  • The convention center’s website – Banner ads, column and button ads on the most popular pages (event schedule, public transportation and driving directions and map). A restaurant directory as well as one for hotels, nightclubs and other attractions should be part of the website. Some convention center websites do an excellent job of posting these directories. View the San Diego Convention Center’s restaurant directory:

http://www.visitsandiego.com/attendees/restaurants.cfm

  • The center’s mobile app
  • The center’s WiFi Portal (opening page)
  • Blogs, newsletters, annual reports, direct mail pieces
  • The center’s social media (Facebook page, Twitter Feeds, Instagram, YouTube, etc.)
  • Exhibitor Manuals and Order Forms

Other

  • Opportunities to publicly display product – A luxury car in the center’s atrium is a good example
  • Collateral reading material and brochures at concierge/information desks
  • Portable cups and napkins in the food courts

Reserving Inventory Exclusively for Events – How much inventory should be reserved for them? The short answer is – any place public that has height and visibility (exterior, curtain walls, light poles, etc.). A well organized center will publish a guide with diagrams showing locations and standards for sign and banner hanging.

Charging Event Management Fees for Advertising Outside of Their Licensed Space – This is an excellent revenue source, at times comprising half of the center’s ad and sponsorship revenue. Most event managers already use most available locations. Besides their own trade dress and directional banners, in many instances they use these locations to sell advertising to their event sponsors, normally in the form of large fabric banners, stair risers, free standing displays, etc. Ten years ago most convention centers permitted events to sell ads to exhibitors using all the aforementioned media and signage without paying location fees to the convention center. I am pleased to see that many convention centers have ceased this practice and now charge fees and commissions. Convention centers which still offer this for free should be well advised to stop the practice. As controversial as it may seem, the architectural prominence and visibility that was created by public investment and the value it creates for such things as advertising banners gives convention centers clear entitlement to reasonable fees. Use of public areas for the sale of advertising to others is normally not part of the event manager’s license agreement. Fees should be a percentage of fees collected by the event managers from their client (say 15%). In the case of public space banners, the percentage arrangement is sometimes not satisfactory. For convention centers, it’s much easier to audit and collect based on size. Exterior banners should be charged a higher rate (say 20%). Ads for other media, such as the Center’s Wifi hotspot “splash” page, use of the Center’s monitors, food court table tops, etc. should be negotiated at market prices.

What’s the Difference between Sponsorships and Advertising?

A corporate sponsorship is a form of marketing where companies connect their name, brand, and products and services to a venue for long term in order to enhance their brand, solidify and expand their markets, showcase their products and achieve future profits. It should not be confused with advertising which is direct and overt and contractually a shorter term. In sponsorships, advertising through signage is inclusive, just one element in a sponsorship plan. A well designed sponsorship generates a stronger and more subtle message. It tends to be more qualitative and has loftier goals than just customer exposure and sales. It is a marketing platform where a company can identify with the best aspects of its partner, where a company can build credibility, prestige and, create a more permanent, lasting bond with consumers.

Who Are the Potential Sponsors?

It’s useful to first separate potential sponsors from ad hoc advertisers. Sponsors should be companies that have a tangible connection and can be easily integrated into a convention center’s core business and culture. There are however more subjective considerations. There has to be the proper feel and fit. It’s difficult to define but it comes down to whether the corporate image is one that complements the convention center, the city and vice versa. While the company should obviously be prosperous, they also need to have a certain brand reputation for reliability and quality, and a high corporate standard for civic responsibility.

Certain industries seem to fit as ideal sponsorship candidates. They are; an airline with a regional or national hub at the city’s airport, a major credit card company, a regional bank which has a solid customer and investment base in and around the city, a utility, a major technology/telecommunications company (preferably one that designs and manufactures, and operates equipment), a media company (preferably local newspaper or TV station), a luxury car company and a long standing major employer for the region. If your convention center is large and busy, then a soft drink sponsor, with exclusivity for advertising and product sales (pouring rights), also makes sense.

Some sponsorship marketing consultants, such as Jim Andrews from ESP Properties in Chicago (www.sponsorship.com) favor technology companies above others. His view is that these companies are in a growth mode, spend heavily on marketing and are generally open to venue sponsorships often seeking these opportunities out, particularly sports and entertainment venues. Another consultant, Hugh Wakeham from WAM Associates in Toronto (www.wam.ca/)   believes similarly but also sees regional banks and utilities as excellent candidates.  He described an interesting case study of naming rights where a utility company Enercare has naming rights to the convention center at Exhibition Place in Toronto. Enercare uses this sponsorship to demonstrate and promote Green technologies. On site for instance, windmills generate electricity and electricity, hot water/steam and chilled water are generated by a gas fired Tri-Generation power plant.

Sponsors will of course require something more than company name and brand exposure through signage.  It is useful to have a list of other things that a sponsor could benefit from such as; exposure on your digital media (website, newsletters, blogs, twitter feeds and WiFi portal, etc.), free passes and parking to popular events that they can distribute to employees and clients, free use of public space to show or demonstrate a product, credits for rent, parking and F&B for an event like a corporate sales or board meeting. You may have to be creative here.  As mentioned earlier sponsors pay close attention to their return on investment. There are items the convention center can track on their own such as product sales on site if applicable and hyperlink openings and page views. It is very likely that a sponsor may ask and possibly tie the result to renewal and fee negotiations. In my time at the Javits Center, it was common for our soft drink sponsor, Coke, to conduct a business review and focus on cases sold per year. The Director of Marketing and Communications at the Shaw Centre in Ottawa, Sylvie Carbonneau, described how their luxury car sponsor, Porsche/Audi, tracked sales based on their car displays at the centre.

For convention centers a successful sponsorship consists of cash and/or a capital contribution (which could be cash or in-kind – telecommunications/internet equipment for example), some accommodation for day to day operations (airline ticket credits for business travel or discounted utilities), cooperative marketing when these opportunities come up and a long contract term 3 to 5 years with renewal options.

Who Are the Potential Advertisers?

A quick list should show the categories below and be accompanied by a map denoting walking time from the convention center and headquarter hotel (normally 15-20 minutes):

  • Restaurants – These can be categorized by type of restaurant, ratings of same, price point and distance from major hotels and the convention center
  • Hotels
  • Parking Lots and Garages
  • Shopping
  • Nightclubs
  • Attractions
  • Professional Sports Venues
  • Concert Venues
  • Theaters
  • Cultural Attractions (art galleries, museums, historical sites)
  • Beer
  • Wine

Other advertisers could be car rental companies, an office and hardware retail outlet, exhibit service companies – general decorating companies, exhibit appointed contractors, A/V companies, computer/technical supply retail outlets. Advertisers, especially in categories where there are many like restaurants, are typically put in easy to read directories which accessible through the center’s website, mobile app and WiFi portal. In my experience, advertisers normally didn’t track ROI closely. As with sponsorships, the convention center should track hyperlink openings and page views because it is likely that an advertiser may ask and possibly tie the result to renewal and fee negotiations.


A Sample Pro Forma

For the example below:

  • Sponsor revenue is based on the Javits Center experience and informal conversations with other convention centers in my consulting business.
  • Advertising revenue is based on my time at the Javits Center and price schedules from convention centers published on the internet. The number of restaurants, parking lots, hotels and attractions is based on those published on the Davis L. Lawrence Convention Center (Pittsburgh) website.
  • Revenue obtained from fees for commercial advertising sold by event managers in public areas and video/digital media is estimated based on the Javits Center experience. Assume that the center’s occupancy in this example is high, say 60-65%. It was then estimated that 15 events would sell exhibitor advertising in public areas of the convention center;

10 events  x  $50,000 in sales = $500,000    5 events  x  $75,000 in sales  =  $375,000

$375,000  x  15% fee  =  $56,250                     $375,000  x  15% fee  =  $56,250

$75,000 = $56,250 = $131,250 (estimated total)

Issue6-1

*Venue obligation includes;

On-site signage, possibly on-site retail
On site video time – large and small screens
Product exclusivity, possibly advertising exclusivity (w/qualifications)
Website Ad
Social media exposure (Facebook, Twitter, Instagram, YouTube)
Mobile APP Ad
Rent, F&B, Parking Credits
Free passes to public events
Cost of above –
– Sales Comm – 5%
– Credits (lost revenue) – $5,000

Issue6-12

*Venue obligation includes;

Website Directory
Social media exposure (Facebook, Twitter, Instagram, YouTube, etc.)
Advertising exclusivity for beer and wine
Mobile APP Directory
WiFi portal directory
Concierge/Information Booth Display and Menu Catalog
On site video time large and small screens – not included in 6 mo fee schedule above; pricing should be at premium levels
Cost of above –
– Sales Comm – 10%

Issue6-3


How to Get Started – Logical Next Steps

 Assuming you have already weighed the benefits and risks and reviewed the market size for sponsors and advertisers, these are logical next steps:

  1. Obtain price schedules from other convention centers that have an active advertising and sponsorship program in place.
  2. Build your own pricing model
  3. Build a pro forma statement
  4. Determine who will do all the administration and sales work. Understand that the sales work is hard work; developing marketing material, making cold calls, making site visits, and price negotiations. Add to that having patience; it will take more than a year to build revenue. Options are; outsourcing, Integrating the responsibility into existing sales force or add to staff with a new hire
  5. Obtain board approval in the form of a policy statement. This is important for two reasons; board members are a good resource for potential sponsors and advertisers and obtaining advertisers and sponsors may be regulated by government procurement procedures which really do not apply to this business function, board approval may help avoid this.
  6. From the city government, obtain traffic counts and pedestrian counts for adjacent streets and sidewalks. From your website administrator obtain internet traffic statistics. Invest in a survey to develop a demographic profile of attendees who normally come to events at the convention center. Typically they are business men and women between the age of 30 – 45 with a higher than average annual income.
  7. Develop marketing material. The link below from the Shaw Centre in Ottawa is a good example:

http://www.shaw-centre.com/wp-content/uploads/2015/12/SHAW-1527876_Advertising_Possibilities_EN.pdf

  1. Develop a face to face marketing message and a sales plan. The marketing message should be one of optimism, one that emphasizes positive changes such as an expansion or renovation, or an investment in video screens and digital technology, or the organizing of a staff to administer and look after the needs of sponsors. Persuade them of your resolve; show them that there is a parity of commitment, that the convention center has “skin in the game”.
  2. Begin work and monitor progress


All About Convention Center Naming Rights

Establishing Naming Rights Value

It’s easy to be lured into believing that naming rights as a financial bonus for convention centers. Decision makers may be influenced by media reporting and tend to overlook that only the global level deals are reported. They hear about deals like the Barclay Center ( Brooklyn Arena-Brooklyn Net home w/18,000 seats) valued at $200M over 20 years or the American Airlines Center (Home of NBA’s  Dallas Mavericks) for $195M for 30 years. In these instances they must realize that the team’s market area is significant with a fan base which is loyal and reliable and stretches to anywhere television and radio can reach. Still, it’s hard not to think about the possibilities and I believe, beyond the blockbuster deals, at some point linear thinking takes over. They see their hometown arena achieve a significant naming rights deal in a small market area and they start thinking and believing their convention center can do likewise. As an example, the Chesapeake Energy Center in Oklahoma City (home the NBA’s Thunder w/18,000 seats) obtained a naming rights deal of $36M for 12 years. The Cox Convention Center across town has 100,000 sq. ft. of exhibit space and a 15,000 seat arena (w/ minor league hockey and an arena football team) and obtained a naming rights deal valued at $1.7M for 7 years, nothing linear about that. Linear thinking doesn’t work when comparing naming rights values to major league sports.

Linear thinking doesn’t appear to work when comparing the values of existing naming rights deals for convention centers either. If you study the table below you will see that it is very difficult to see any sense using valuation methods (cost, income or market valuation) when it comes to establishing a convention center’s naming rights value. The comparisons are too few, the market sizes and the venue sizes too diverse to see patterns. Additionally some relatively small markets have achieved surprising value; the HY-Vee Exhibition Hall in Des Moines is a good example ($8million with a term of 10 years).

From the current number of naming rights deals (14) the following characteristics are evident:

  • Naming rights deals were closed during or after new, expanded or major renovations took place.
  • The core market areas for most companies holding naming rights are regional. One reason to pursue naming rights is to maintain and solidify the markets they already have. For those who are not historically regional, their eye is on expansion to new regional markets. This was the case for naming rights deals in Niagara Falls, CA – Scotiabank Convention Centre and Ottawa CA – the Shaw Centre.
  • Most are for 2nd tier markets in the US. I am convinced that convention centers in 2nd tier markets in the US are the best naming rights candidates.
  • Proportionally Canadian convention centres are more likely to pursue and successfully close on naming rights in 1st and 2nd tier markets than the US
  • The financial sector (banks, finance companies and insurance) have the highest percentage at 57%, technology companies next at 22%, then utility companies at 14%. At one point an airline held naming rights but that contract has lapsed.
  • About 40% of the naming rights holders were acquired by other companies during the naming rights term. Expect name changes.

Issue6-4

What’s in a Name?

For a convention center, I think there’s a whole lot in a name. It may sound trivial and shallow but the sound and the emotional response of a name can result in a name that can be so inappropriate, awkward and some say hideous that it is cause for public embarrassment and ridicule. There are many examples; The KFC YUM! Center in Louisville, Whataburger Field in Corpus Christi, Smoothie King Center in New Orleans and the  Bargain Booze Stadium in the UK.  Fortunately none of these venues is a convention center. One convention center in Des Moines had a naming rights deal with the final name being the Veteran’s Memorial Community Choice Credit Union Convention Center. In my opinion the name is an awkward mouthful. Common sense prevailed in this instance and the exterior sign remained The Veterans Memorial with the longer version seen less prominently in the interior of the facility.

The Inherent Difficulties for 1st Tier US City Convention Centers Pursuing Naming Rights

The success rate shows and I am convinced that convention centers in 2nd and 3rd tier markets in the US are the best naming rights candidates. Not long after new management took over the operation of the Javits Center in 1996, a private conversation regarding Javits progress took place where I was present. .By chance the subject of naming rights came up. Business at the center was turning favorable rapidly and the idea of naming rights seemed a natural. The conversation ended but no subsequent actions were discussed or planned. Within days, a bill was introduced in the NY State legislature prohibiting any attempt for a name change to the Jacob K. Javits Convention Center. I am certain no one at the meeting talked about it and clearly the draft of that legislation was prepared long before our meeting took place. So I learned how these matters evolve. I believe wise and experienced convention center managers at 1st tier convention centers know in advance the likely outcome if naming rights are aggressively pursued.  If the center bears the name of a beloved and respected political leader, alive or dead, the effort will be mired in controversy. Potential naming rights sponsors will steer clear of the controversy and convention center leadership will be happy to oblige. If the center only bears the city’s name it is possible that the potential deal value will drive an action plan. Expect pride of place advocates to object to a name change. If that doesn’t discourage the effort, government procurement procedures pose another impediment. Acquiring naming rights is not on any company’s annual marketing budget. Candidates for naming rights have to be courted and persuaded; a process that does not fit into the typical RFP process.  This process needs to be conducted quietly whereas the RFP process is blatantly public and gives cause for a company to decline to bid. Convention centers should also seek out the services of a marketing consultant, one who has closed naming rights deals before and understands the language and nuances of naming rights valuation. In my experience and in all the research I conducted, none of the naming rights deals closed by following a traditional RFP process and most sought the help of a marketing consultant.

Recommendation – An Alternate Idea to Full Facility Naming Rights

There are some excellent examples of convention centers where portions of the centers are offered for naming rights. The David L. Lawrence Convention Center in Pittsburgh sold rights to its 34,000 sq. ft. ballroom to Dollar Bank for $1M and a term of 5 years. The Dollar Bank graciously named the ballroom “The Spirit of Pittsburgh” and installed several displays depicting the history of Pittsburgh throughout the center. At the Colorado Convention Center in Denver naming rights to its 5,000 seat concert theater were sold to Bellco for $1.25M at a term of 5 years. There are discrete and iconic architectural spaces that have naming rights potential in many convention centers; an elegantly designed ballroom, an outside terrace or garden used for special events, an architecturally prominent lobby, a new meeting room suite or technologically advanced boardroom. Convention centers which are very large and subdivided into separate buildings offer unique opportunities for naming rights. Imagine the four principal buildings of McCormick Place (the North, South, West and Lakeside Center) bearing corporate names. The tradition and integrity of the McCormick Place name stays in place and an excellent revenue prospect is exploited. I see similar possibilities at the Orange County Convention Center, the Vancouver Convention and Exhibition Centre and the Moscone Center.

Save

Save

Service Profit Centers at Convention Centers – Electric Services – How to Evaluate Current Business and Improve Revenues and Profit

In today’s convention centers designers have specified electrical capacity and distribution to service any event in the market with respect to electrical demand per square foot. They have truly “built the church Easter Sunday”. The distribution network is uniformly distributed in floor boxes across exhibit halls for 110/208V applications and there is usually a high voltage (460V) bus or connection panel overhead to handle discrete heavy electrical loads or to supplement floor box capacity. In my experience I have only seen a capacity problem a few times and that was just for an exhibit hall, not the full facility. Normally for events, convention centers experience a high diversity factor. Diversity factor is defined as: Total Connected Load/Actual Maximum Load and it demonstrates the degree in which surplus electric capacity was designed and built.  The investment in the electrical infrastructure; floor boxes, distribution cabling (embedded in exhibit hall floors), distribution panels, transformers, switchgear, and high voltage feeders (with capacity redundancy) is substantial and rarely fully utilized. The recurring costs of cleaning, maintenance and periodic testing is significant also.


How Are Electric Services Rendered for an Event?

A team of electricians normally begins connecting, labeling and laying out cable for each exhibitor ordered service, directly following exhibit booth mark-out. Cables are coiled and labeled at the back end of each booth or laid out, taped down and positioned in accordance with exhibitor plans. The usual service is one plug-in point and services are sold in that fashion. High voltage service requiring an overhead cable drop is normally supplied at the same time. Other services; connecting exhibitor equipment, installing rented lights, and dressing wires are completed during construction of the exhibit booth. For a well organized team, the fulfillment of advance orders before the event commences move in can be done efficiently, before freight move in is well underway and detailed exhibit building begins. Fulfillment of electrical orders received on site is of course more difficult and time consuming. Labor is by far the largest cost element in rendering electric service, other cost elements, materials, supervision, electrical consumption and administration are relatively minor.

Electric Services as a Convention Center Profit Center

Electric service ranks in the top three or four profit centers for convention centers along with rent, food & beverage sales and internet/telecommunications. It’s a reliable source of revenue and necessary to reduce dependence on subsidies to cover operating expenses.  If your center has the opportunity and drive to reach a position of needing no subsidy – where earned revenue will cover expenses and then some, your team will need electric services to achieve that goal.

There are three typical business arrangements:

  • Self Operation (also referred to as “in-house”) – The convention center provides this service through their own utilities division. The division is responsible for all aspects of the business; management and floor supervision, administrative of service orders, obtaining a labor force with all the HR functions included (hiring, firing, training, payroll, etc.) , material purchasing and inventory control, planning and implementing event installation, customer service, and probably a great deal more.
  • Exclusive Electrical Contractor – Convention centers may choose to have an exclusive contract with an electrical contractor. The choice of contractor is normally the result of a competitive process. The process is characterized by rigorous due diligence which examines all the aspects of operating a service business. Final selection often requires approval of the board of directors. Commission rates range from as low as 12% to as high as 35%. Occupancy and the nature of booked events clearly influence commission value.
  • Open (Show Manager’s Choice) – This choice is not as open as the phrase implies. Convention centers normally must approve the contractor and many already have a list. Los Angeles Convention Center for example has three approved contractors. Sometimes the center will issue a “preferred” list of contractors. The review or vetting process for approval usually covers items like a financial review, a safety record review and adherence to required union collective bargaining agreements. Most convention centers require a fee or commission on gross revenue be paid by the contractor to the convention center for use of the facility.

Pricing of Electric Services

Most convention centers and/or their exclusive electrical contractors price their services on a market basis. Convention center management recognizes that cost- plus pricing, while simple and easy to justify, is not an effective pricing strategy. Cost- plus ignores competition. A convention center could decide on service prices based on the cost- plus formula and then be surprised when it finds competitors charging substantially different prices. This can unfavorably impact on the profits a center can expect to achieve or put their market share at risk due to high prices. The center either ends up pricing too low and giving away profits, or pricing too high and experiencing an erosion of revenues.

A typical price schedule sets prices in accordance with different operating voltages and electrical demand (watts) for 110/120 Volt service and in current (Amps) for 208 and 460 Volt service. For the later there is a premium placed on three phase service. The prices of course vary from city to city and it’s evident that consideration is given to the pricing of regional and national competitors. Rental items such as plug-in strips or display lighting are also priced on a market basis. At first glance of an electric service form these prices appear as a flat fee. It’s the application of labor charges to these flat prices which make things confusing and questionable; often a source of resentment from exhibitors. Hourly labor prices (which are wages, benefits, taxes plus a mark-up) are high considering the rudimentary level of skill and training required. Some convention centers, Boston Convention and Exhibition Center, the Javits Center, the Orange County Convention Center, the Austin Convention Center, the Indiana Convention Center include labor in the price of all 110/120V, 208V and 460V service. From a customer service view this is a wise and politic pricing strategy. There is predictability for exhibitors and there is no uncertainty or distrust of labor productivity. The margin risk is all on the convention center.

Which Business Arrangement Fits Your Business Model and Financial Goals?

There is a tipping point where self operation of electric services makes the most business sense. It would require a favorable history of occupancy and electrical revenue per net square foot with reliable forecasts of consistency and growth.  As a rough estimate, I believe the tipping point would be an occupancy rate of about 50% where the majority of the events are trade and consumer shows or conventions with exhibits. Otherwise, the sensible course is to retain an exclusive electrical contractor, large enough to sustain business due to work elsewhere. The contractor must be able absorb the overhead required to keep the convention center arm active and to reliably organize a capable work force for events.

Convention centers contemplating a transition from an Open arrangement to an Exclusive Contractor or Self Operation will find a more challenging situation. The Open arrangement typically exists in convention centers which are large with excellent occupancy, and well booked with trade and consumer shows and conventions with exhibit floors. It exists in Las Vegas, San Diego, Los Angeles, Anaheim and San Francisco. It also exists in Miami Beach and Chicago at McCormick Place.  The Open arrangement is an attractive bonus for tradeshow managers as most contractors working directly for the show pay show management a commission on revenues received from exhibitors. Convention centers too often demand a user fee from whatever electrical contractor the show manager selects, dividing the contractor’s revenue further.

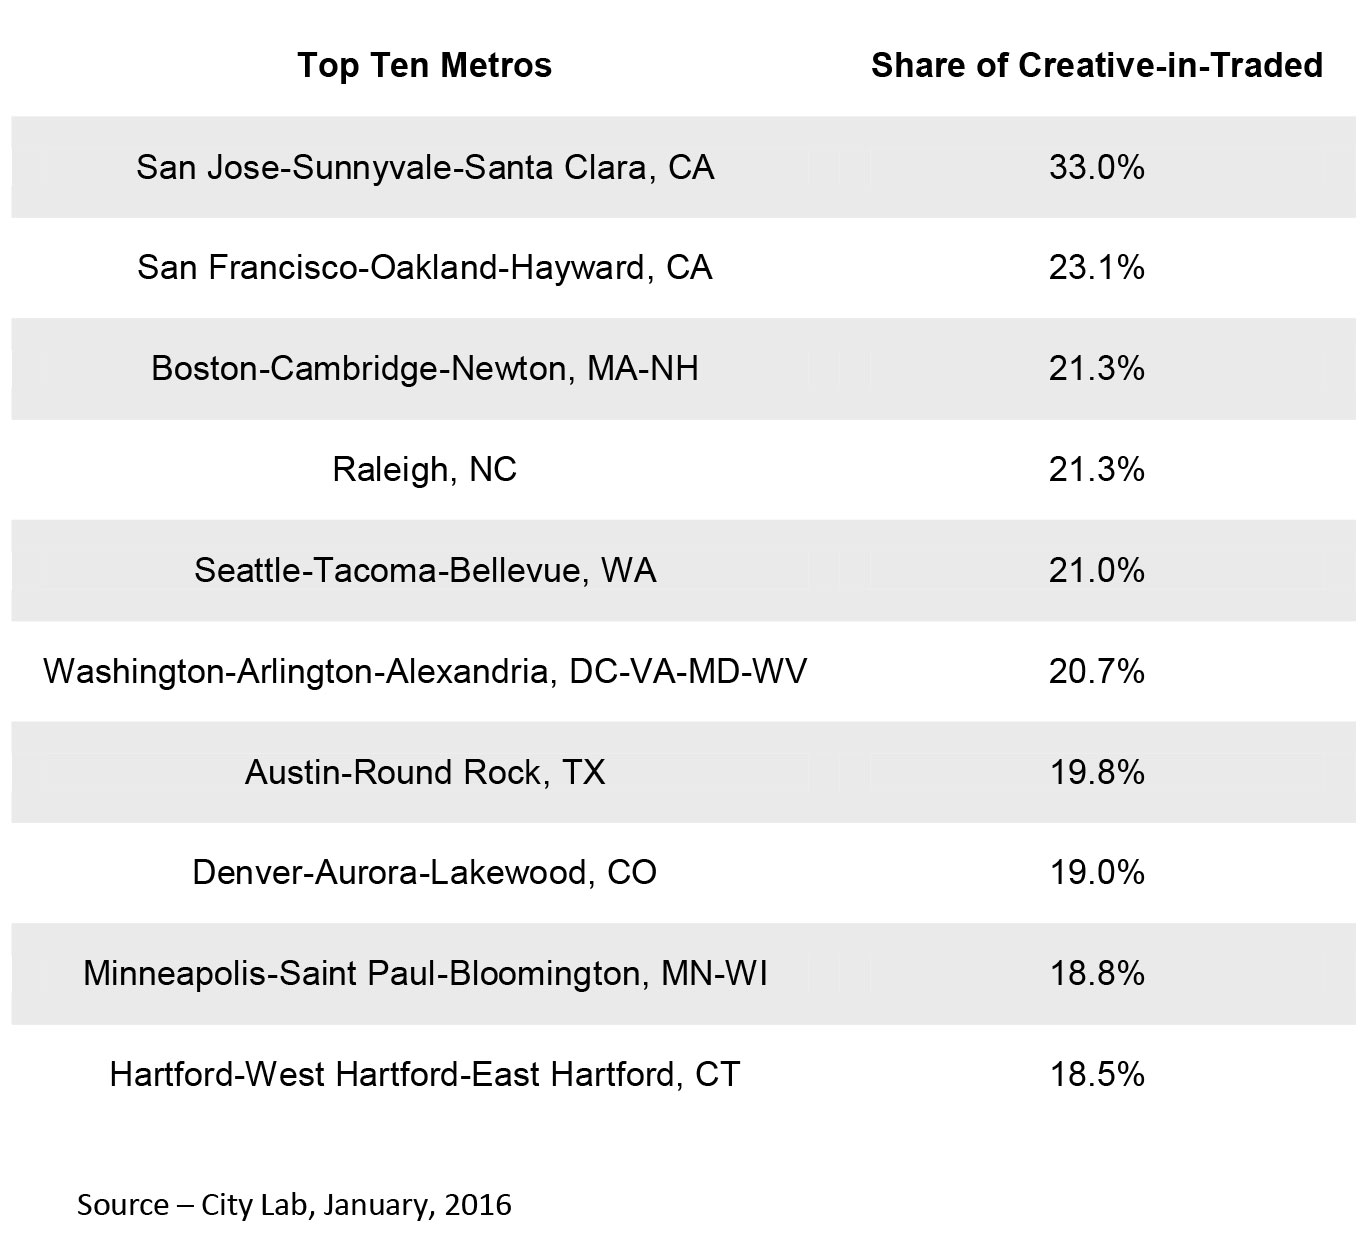
There will be controversy surrounding the decision if a center elects to change certain businesses from Open to Exclusive or Self Operation. There has been one recent controversy that became very public. The example often cited is the dispute between the San Diego Convention Center and United National Maintenance. It involved transitioning from an Open business arrangement for event cleaning services to Self Operation. The dispute carried on for years through the courts and then to an Appeals court before the ruling came supporting the convention center.  Negative publicity was aggressive and shrill. Tradeshow advocacy organizations (SISO, ESCA, IAEE) all offered support warning  the San Diego Convention Center’s actions would “….. most likely will cause organizers to look for more user-friendly venues “ and “create an open door policy that will allow the center to institute new practices of exclusivity that can reduce service and increase costs to all parties.”  The outcome has been that the San Diego Convention Center is still a venue in great demand and has just finished their most successful year. The irony is that none of the assertions about service quality and high prices are true. Convention centers which have an Open arrangement for electric services are by far the highest prices nationwide (see table below). We researched several price schedules for each Open arrangement and it was rare that we found service and labor prices set at a value to help exhibitors (see table below). Additionally, it was evident that certain business practices such as piling on high priced labor to 110/208 or 460V service, charging absurd labor prices for service ordered while on site, insisting that all electrical work, no matter how rudimentary, is the jurisdiction of their electricians, are the norm.  A review of current service order forms nationwide showed these practices slowly disappearing from convention centers which are handled by Exclusives or are Self Operation.

In the table below note that the 110V prices are composite prices based on historical service order proportions at the Javits Center; 500W – 52%, 1000W – 24%, 1500W – 16.5%, 2000W – 7.5%.

Issue5Graph1

Considering the business volume in trade and consumer shows at some of the convention centers the prospect of changing from Open to Self Operation is very attractive. The pricing could be moderated and stabilized somewhat, service prices could become flat rates, the time and material charges could be eliminated, center management would have another fee that could be used during negotiations to attract new business and of course profits in excess of the fees already received are a certainty. The legacy of current pricing and the fact that revenues are not divided up for commission and fees to others make it so. Self operation would give the center better control over staffing, better negotiating leverage over the union work rules and better control over circumstances where there is a series of events with compressed move in time.  I acknowledge that this would be a tough decision.  Perhaps it is in your best interest to leave things alone, allow the shows another opportunity to profit. I personally have seen shows which were having great success at the Javits Center, take the risk and choose another city and venue where rent concessions were offered that Javits would not match. Above all the advantages New York had, more attendees, more exhibitors, more media attention, profit mattered most.  My advice if you are considering such a move is to be impeccably well prepared, prepare your board leadership for the criticism and over-the-top claims from the trade show industry and trade show press, prepare your legal team for some form of legal action, be strong and assertive when the dialogue gets out-of-bounds both in fact and tone and conjure up a little intestinal fortitude.

Ways to Increase Electric Service Revenues and Profit

Understanding, Evaluating and Acting on Your Pricing Power

For those unfamiliar with the term “pricing power”, Investopedia explains it like this,

Pricing power is an economic term referring to the effect that a change in a firm’s product price has on the quantity demanded. Pricing of that product power ties in with the Price Elasticity of Demand. Generally speaking, if a company doesn’t have much pricing power then an increase in their prices would lessen the demand for their products.”  In this circumstance, demand elasticity may be seen in certain exhibitors choosing not to exhibit, or a reduction in the size and complexity of exhibit booths, or worse – an event manager re-locating to another city and venue because of high prices.

Comparing Base Pricing Shown below are two examples (Orange County Convention Center and Austin Convention Center) which were chosen because they were clearly underpriced compared to regional and national competitors. The examples also demonstrate how pricing power can be evaluated.
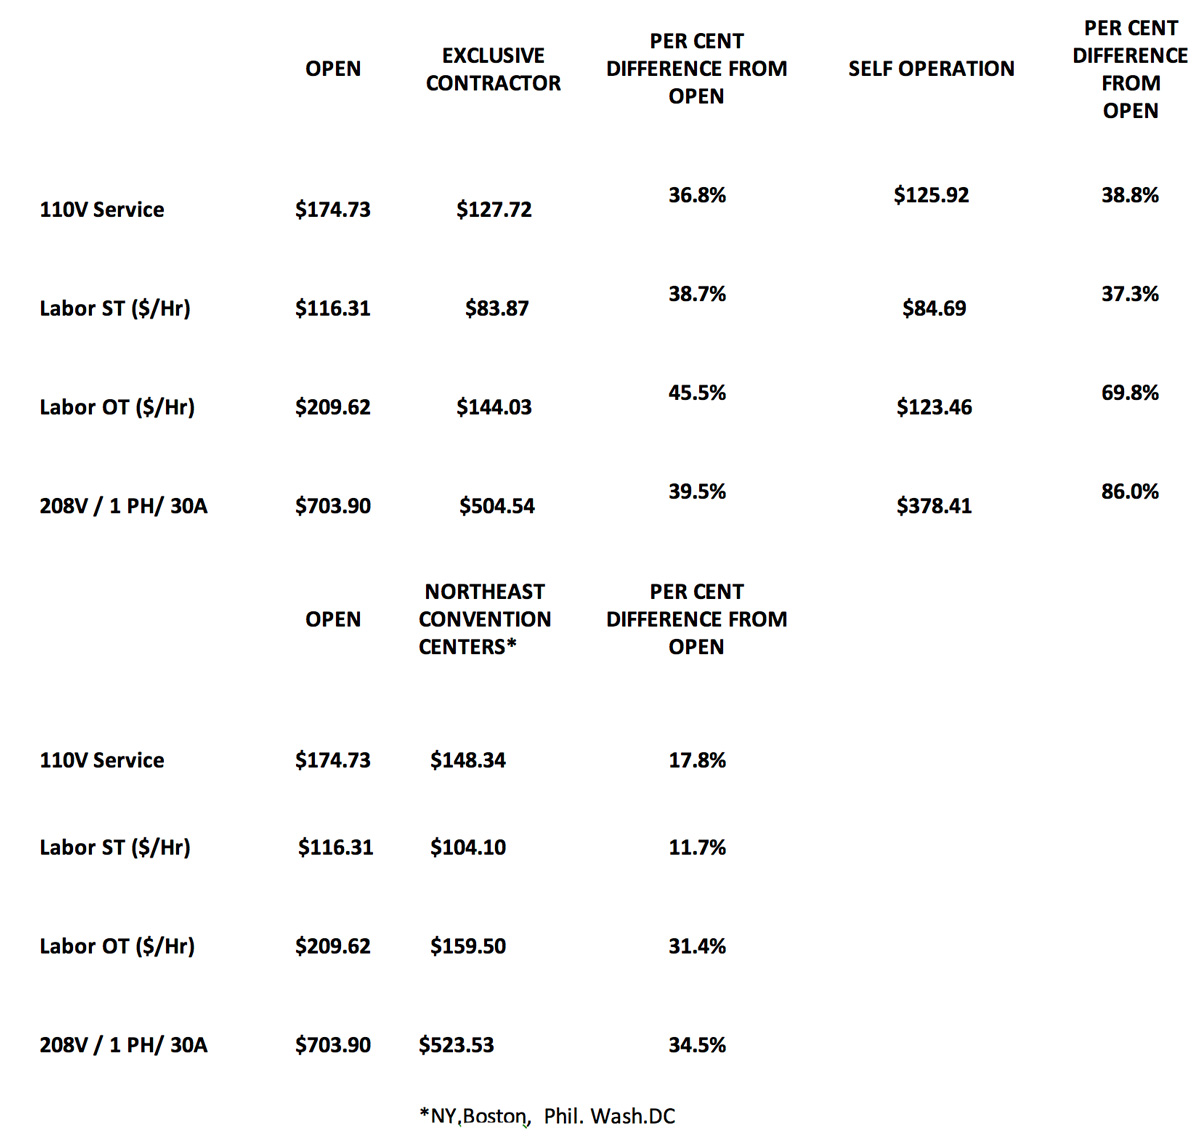
  • Orange County Convention CenterThe Orange County Convention Center has a 9.6% market share of “Top 250” trade shows and conventions, ranking 2nd in this highly competitive market. The facility is a formidable competitor nationwide for many economic sectors. The analysis below shows how the center ranks with respect to electric service pricing when compared to direct competitors for Top 250 events and major medical events that rotate annually from city to city.  It’s important to note that in both examples market share and the price of electric services had no statistical correlation, i.e., high electric prices did not lower market share nor did low electric service prices increase it.

Issue5Graph2

Issue5Graph3

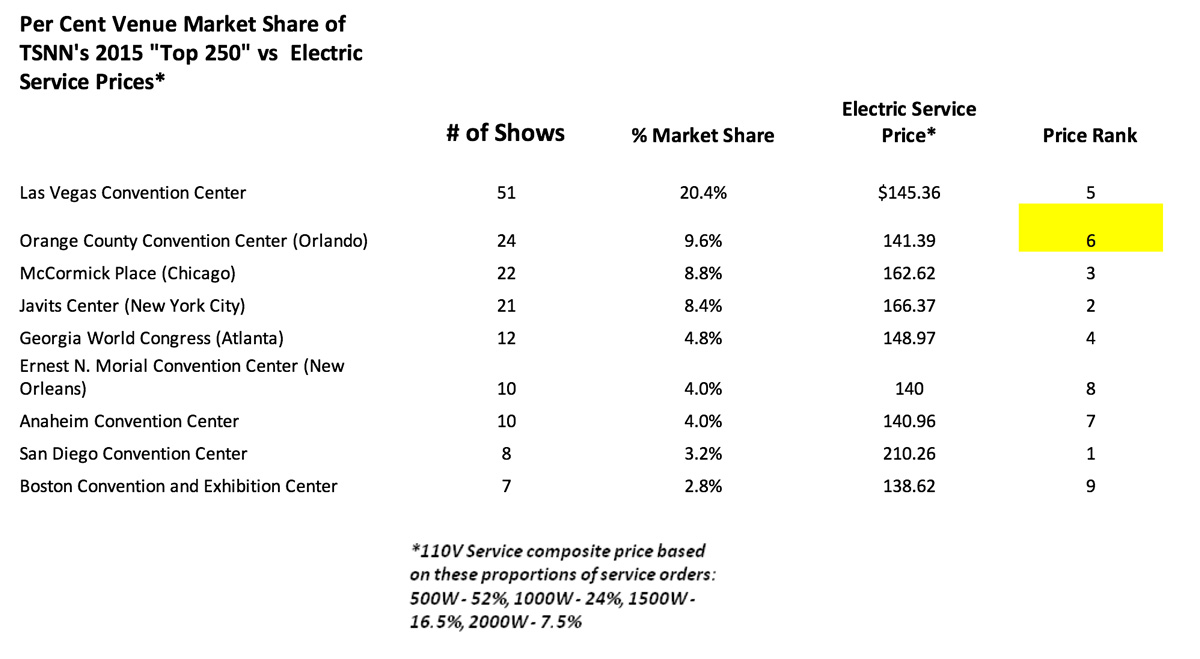
Given the above, what is the pricing power available to the Orange County Convention Center?  For Medical events, the center ranks at about the median and below the average of $145.19 by 2.7%.  For Top 250 events the center ranks below the average of $155.30 by 10%. A comparison of single phase 208V service prices shows an even greater split between Orange County and the other market share leaders of over 75%. While the proportion of high voltage service for trade shows is low compared to 110V, the span of difference only adds to the pricing power that Orange County possesses.

From Orange County’s annual reports it was learned that revenues derived from electric services are about $11 million annually. The price adjustment of 10% would yield an additional $1.1million and would not pose a business risk. It would have to be rolled out gradually and with some forethought and finesse. For example, would the price increase affect the convention center brand element of affordable pricing? Based on the analysis above, I do not think it would.

  • Austin Convention CenterThe Austin Convention Center is enjoying a lift in reputation driven by such popular events as South by Southwest (SXSW) which has become a national music and cultural event. It is also a venue in demand for IT sector events and annual meetings for state professional associations. The state association business is a sector that it must compete for against other Texas cities and venues. The analysis below compares electric service prices to other state venues.

Issue5Graph4

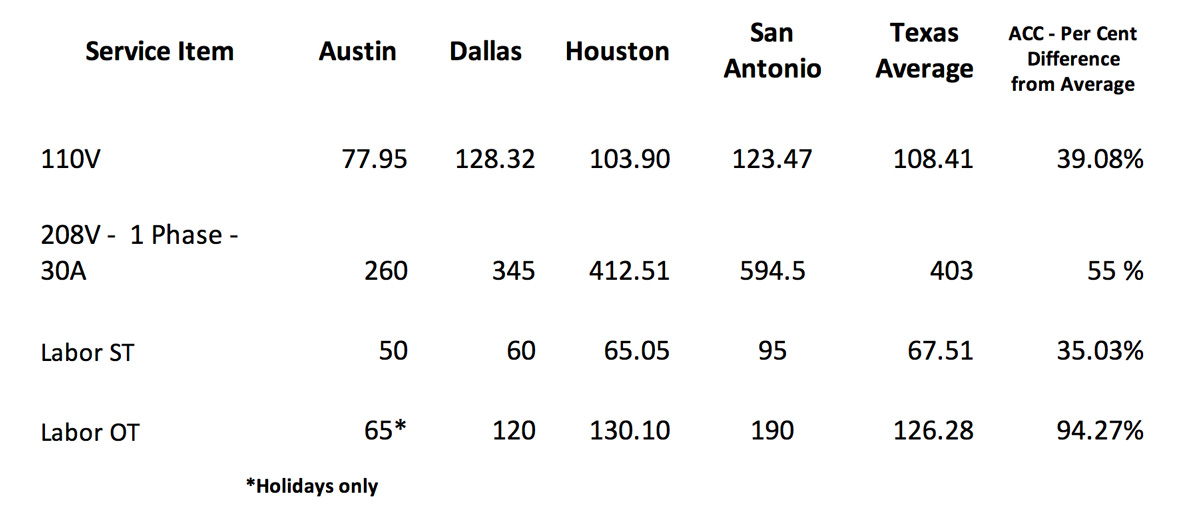
The Austin Convention Center is nearly 40% less than the average price for 110V services (the most ordered services). From the City of Austin’s annual reports it was learned that revenues derived from electric services are about $2.5 million annually. The price adjustment of 10% would yield an additional $250,000 and would not pose a business risk; 20% would yield $500,000.

Both Orange County and Austin are good examples of how a relatively simple analysis can expose some revenue opportunities which don’t require investment and on the surface pose little business risk. Cautious convention center management may need better assurances of how an underpriced revenue situation could be solved using pricing power while not adversely affecting the normal exhibitor service requirements or their intentions to increase service. In this instance I would recommend a survey of exhibitor attitudes be done independently.

Another Method to Use Pricing Power – Make All Exclusive and Self Operation Electric Service Order Forms Access Controlled  – There are other methods related to the service pricing and the presentation of the pricing schedule which can be used, especially with a self operation arrangement, to increase revenue. These methods are practiced mostly by the electrical contractors who work in the Open arrangement previously described. There appears to be a real “tradecraft” in their practice. There are many reasons related to security for making all on-line service orders access controlled. Access control also all permits convention centers to make price changes based on the type of event or prior history of the event; certain industry sectors are less price sensitive than others, prior event history may show that certain service or rental items are ordered more than others, certain type of events may have more late or floor orders than others, etc. In all cases the pricing adjustments should go up, not down and most importantly – don’t overreach.

Increasing Profit through Productivity Gains

Structural Changes to Electric Service Work Jurisdiction – There is a silent conflict that exists between two trade groups and their work jurisdictions which impedes the ability to increase productivity and profit for electric services.  The conflict is between electricians and carpenters or stage hands (who assemble exhibit booths). In most exhibits there is some placement, dressing or connection of electric cables to devices which are integral to exhibits or attached such as a video screen or exhibitor owned display lighting. The connections referred to are simply devices using a straight stab plug to a power source supplied or an extension cord. Electricians generally win the argument. That means that electricians normally have to re-visit the exhibit booth sometime after the base power is supplied. At this point the aisles are crowded with freight, other tradesmen and exhibitors. It’s time consuming, so the time to fulfill an electric order is increased and productivity declines  

Two convention centers have recognized this and wisely changed these rules, the Boston Convention and Exhibition Center and the Orange County Convention Center. In both cases the service order forms state that electricians are not required to be used for electric distribution within the exhibit booth; General Service Contractors or EACs (carpenters) or exhibitors may do that work themselves.

The Javits Center Experience in Boosting Productivity – 1997 to 2008 –  By the end of 2000 Javits management reckoned that their electric service pricing power had run out; that increasing service  prices may result in a decline in service order growth, exhibitor complaints and possibly recurring shows looking for other venues. Our national competitors had begun to moderate their prices but more disquieting was that some competitors had started to offer heavily discounted rent or no rent in order to gain market share. We had been casually tracking key performance indicators (KPIs) such as labor hours per billable item, electric revenues per net square foot per show and per exhibit hall and order fulfillment percentage per move in day. Now the KPIs had become much more meaningful and we acted on what the KPIs showed. We set productivity goals, labor hours per billable item and electric revenue per net square foot per exhibit hall worked best. We held labor supervision accountable for improvements in labor productivity and surprisingly did not have to make many personnel changes. Productivity climbed. Profit margins climbed concurrently to about 30%. Once the work habits and routines and the necessary levels of productivity were understood and accepted, price increases became modest, keeping us competitive. Labor rates did not have to be applied to service rates because we had confidence in including labor costs in flat rates.

Adding New Products and Services

Here are a few examples of things that have worked:

  • Sale of extension cords of differing lengths
  • Sale of spare light bulbs. Carry a ready inventory of common retail display lighting
  • Rental of high wattage light fixtures with a high color rendition index (above 80). If your center hosts fashion, textile, gift, automobile or art shows, then an investment in this type of lighting may be a worthwhile expenditure. The lighting is normally suspended from overhead lighting truss or catwalks. The price point for rental units is high ($ 325 at the Sands in Las Vegas and $341 at the Javits Center). Sales volume is also very high. At Javits this lighting comprised 8% of total annual electric revenue.

Recommendations

  • Is your current business arrangement in your center’s best interests? Consider self operation of electric services. It may be the best method to increase revenues
  • Do a cursory comparison of base pricing, labor pricing and time and material pricing of your regional and national competition .Make judgments about your pricing power. If you find opportunities drill down further
  • If results are favorable, create a new pricing schedule and simulate a new year using previous years business volume and service order proportions. Review forecasted revenue results.
  • Share results with board members. Persuade them to buy in to a change
  • Review all your internal procedures; planning, labor assignments, KPI tracking, material control, etc. for the purpose of increasing productivity. Plan on changes and forecast results.
  • Revisit pricing schedule and simulation and factor in predicted productivity gains. Review forecasted profit results.
  • Make a decision to launch new electric service pricing
  • Invest in software to create on line access control for electric forms for each show
  • Launch new pricing. Do so gradually and let show managers know. Don’t overreach.

For convention centers interested in improving service revenue and profit, consider the services that MTMConsult, LLC can provide. Our team of experienced practitioners with real field experience will drill down to the important details and provide actionable results.

Email us at advisor@conventioncenternow.com  or call – 203-273-6999


The Math and Logic behind Sales Forecasts in Convention Center Expansion Feasibility Studies

In my time at the Javits Center, I was personally involved in three expansion feasibility studies with two different consulting firms. My intention in this piece to explore the sales and marketing forecasts which are considered and are integral to economic impact estimates and ultimately convention center financing and construction.

The acquisition of investment financing, especially at the scale of a convention center expansion, requires a feasibility study prior to launching the project. Traditionally expansion feasibility studies consist of several phases that fall under these categories:

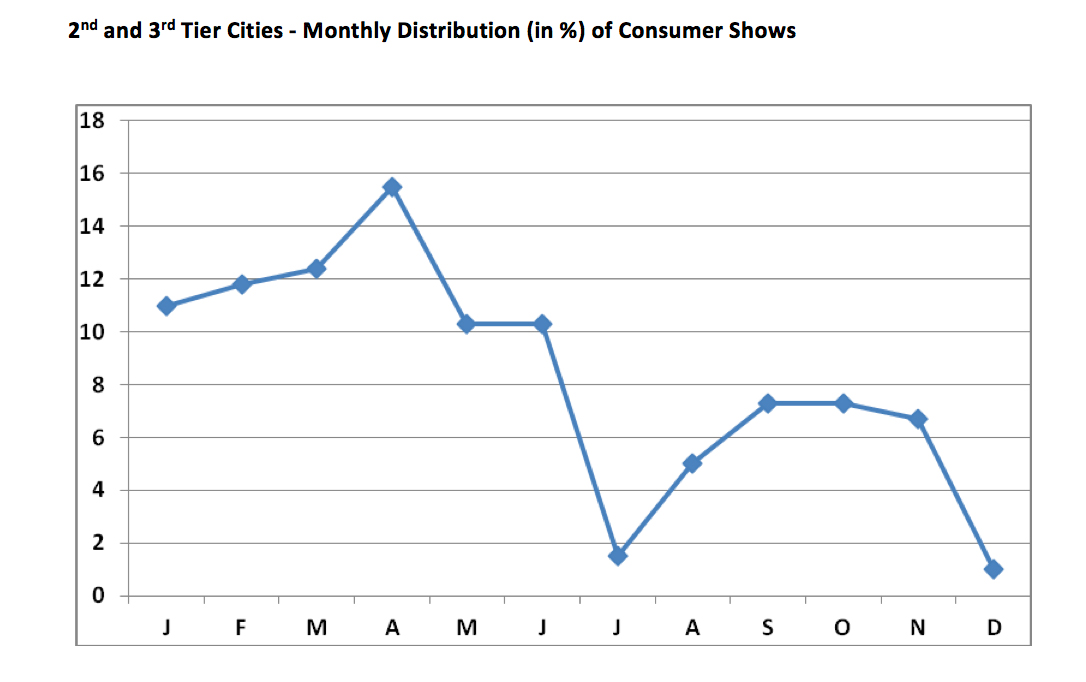
  • A review of history of event activity (# of shows by type, by season or month)
  • A review of history of occupancy (the whole convention center, by month, by space – exhibit halls, meeting rooms and ballrooms)
  • A review of history of attendance (for all events, by event type, by season or month, with out of town attendees broken out)
  • Competitive analysis of the same performance statistics above
  • Competitive analysis of the size for the whole facility and by exhibit space (incl. # and size of subdivisions), meeting rooms (sizes and #) and ballrooms
  • Destination comparisons and rankings for competitive cities such as reputation as an event city (all and certain sectors) and other city attributes such as hotel inventory and brand mix and distance from the center, airport service and passengers per year, etc.
  • Forecast of new events if certain actions/investments are taken. Presumably facility re-fit and renovation and/or expansion.
  • Estimate project costs
  • Estimate new income
  • Estimate ROI
  • Estimate incremental quantitative economic value/benefits ( event attendee spending, direct and indirect employment) and qualitative benefits

There are some impediments and challenges to accomplishing the above:

  • Firstly, few convention centers keep disciplined records of performance indicators that neatly fit a feasibility analysis (occupancies, net square footages, event attendees, profit/loss per event and per event type or profit/loss per net square foot). Occupancy especially is troublesome because some convention centers measure differently from the prescribed method.
  • Secondly, many industries are well covered by academic research and scholarly articles citing statistics and making thoughtful rational explanations. For the convention and trade show industry there are few, especially in regards to convention center expansion. Occasionally there is an insightful article in newspapers or business magazines, but not the scientific or rigorous statistical analysis you might expect to see.
  • Thirdly, attendee numbers are mostly self reported by the event managers, very few are audited results. Most experienced convention center management teams regard them as probably exaggerated and unreliable. Conversely hotel room nights are reliably reported and most CVBs track these statistics. However, these statistics are many times under reported. For mature shows that consistently have returning attendees each year, there is anecdotal evidence that many book their own hotel accommodations and are not reported in the “room block” (where the hotel room night statistic is derived).
  • Lastly, many feasibility studies were strongly influenced by the intensity and drive of local hospitality businesses, all with the enthusiastic support of political leadership. For consultants it is and was difficult to stay objective. That seems to be changing over the last few years.

Where Things Stand Now

Trade and Consumer Shows and Conventions with Exhibits

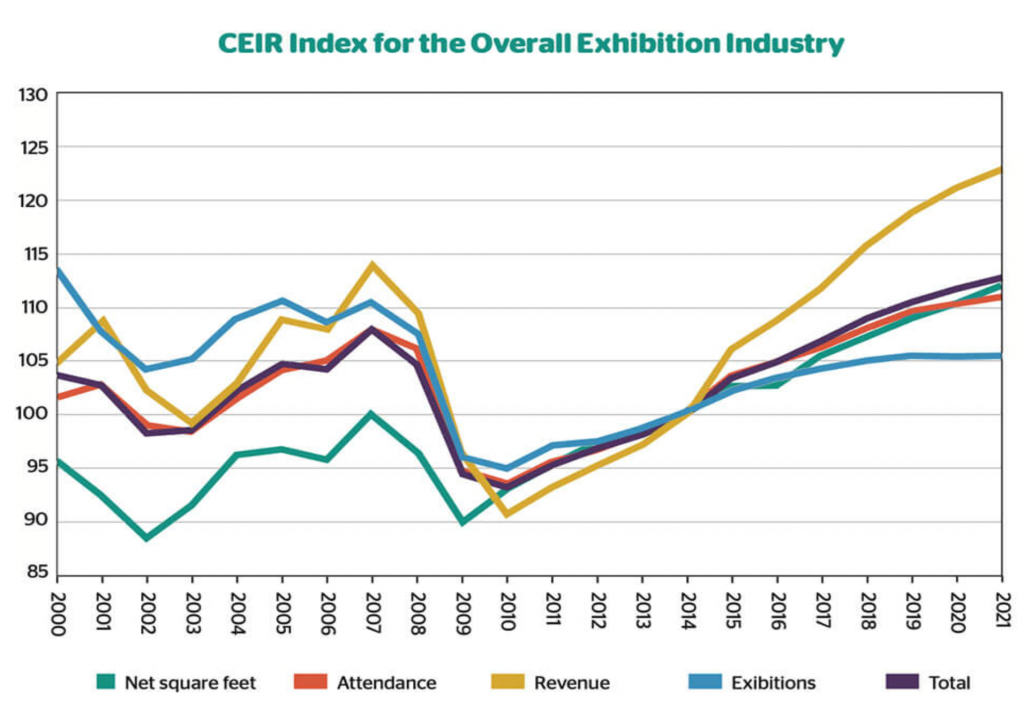
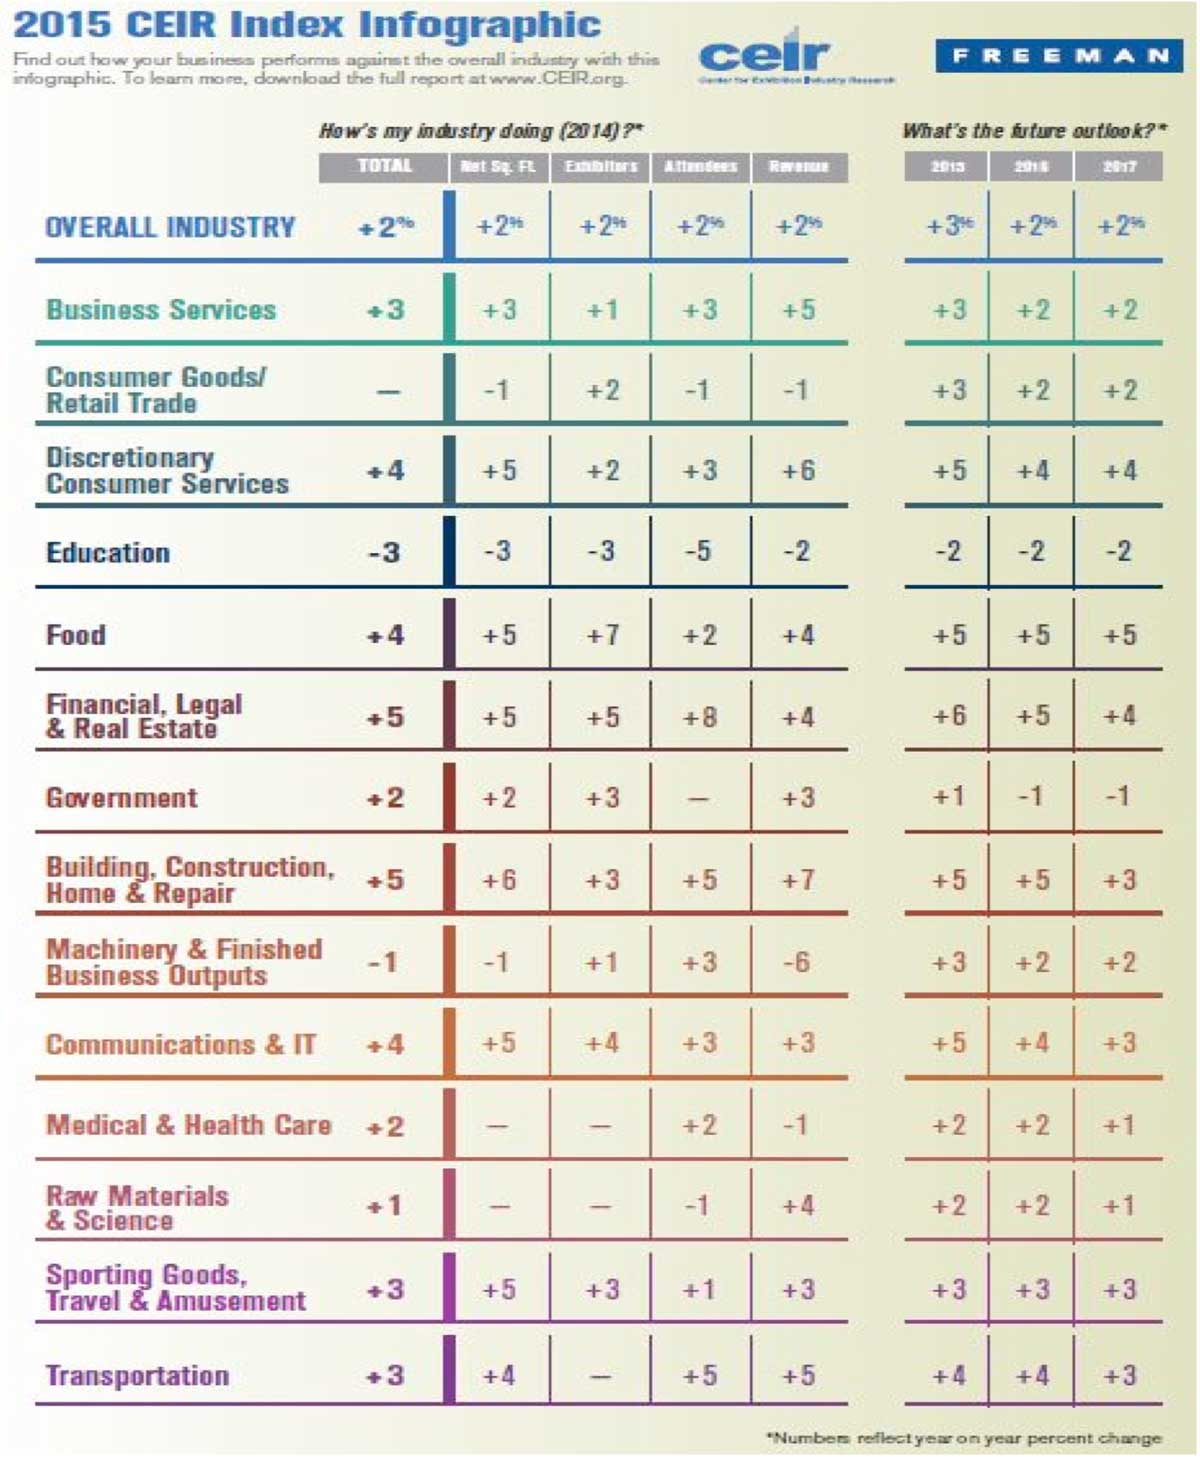
Tradeshow and convention directories list over 5,000 trade and consumer shows and association meetings or annual conventions. Generally not listed are private corporate events like annual sales meetings, IT developer conferences, or product roll outs and demonstrations. The very information rich table shown below is taken from CEIR’s forecast of industry growth from 2014 through 2017. You can download it at   https://www.ceir.org/sites/default/files/CEIR%202015%20Index_Infographic_0.pdf.  As shown, the growth rate is 3%, which puts the industry back at pre-recession levels.  The only industries in decline are education and government services.  Note that the statistics measured which make up the CEIR Index are net square feet, attendees and # of exhibitors, some of the same statistics which are important when judging convention center performance.

Issue5Graph5

Convention Centers

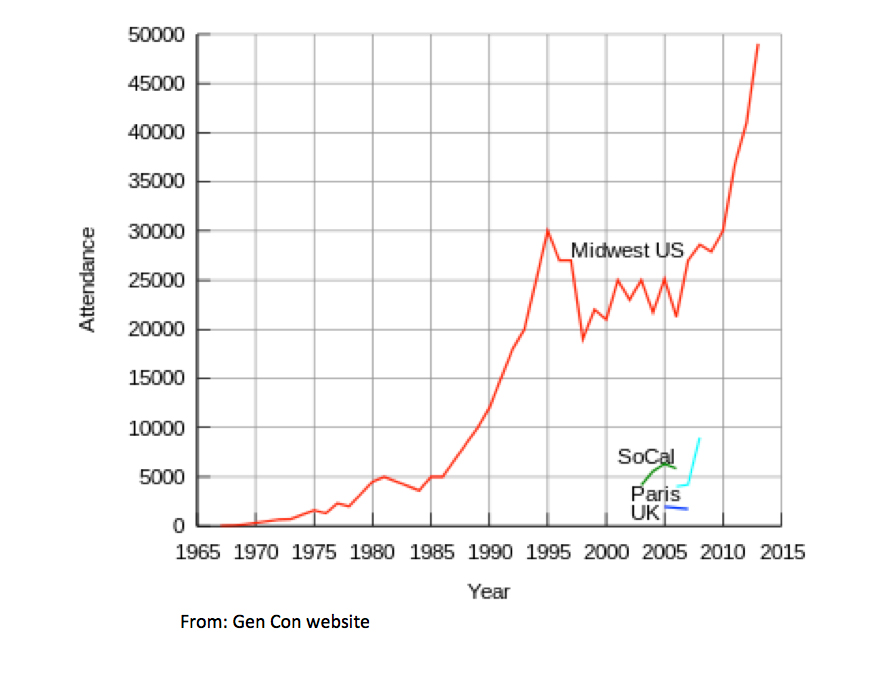
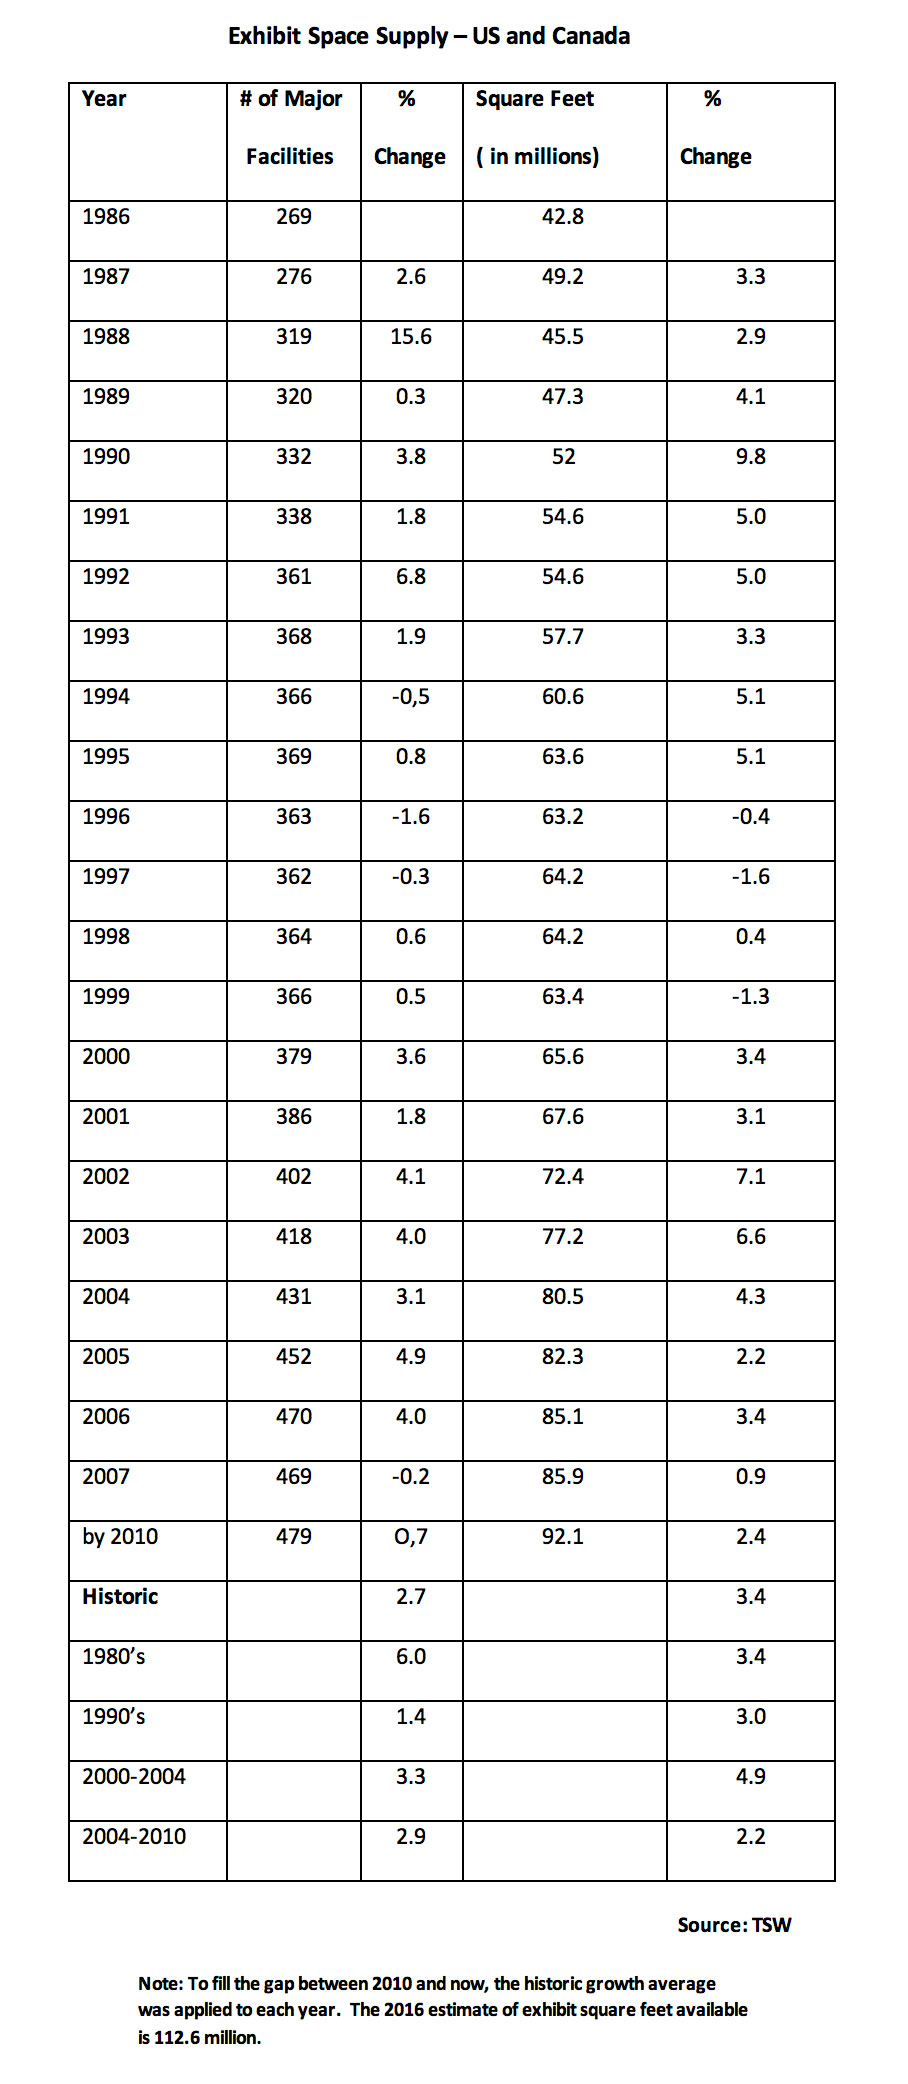
For convention centers there is no CEIR to act as a clearinghouse of data collection and analysis… The industry used to rely on Tradeshow Week (TSW) to periodically publish information in directory style about the amount of exhibit space available nationwide and then apply a percentage growth and make a forecast for the next year. TSW ceased publication in 2007 and the easy to follow directory was not available.  It is instructive to look at the rate of growth through the years that TSW was published:

Issue5Graph6

There is no way to statistically tie the scale of total exhibit space and the rate of growth to the scale of shows (expressed in net square footage) and their rate of growth without an extensive research project. Other consultants have tried to make adaptations to the facts they could find supplemented with many assumptions. Their attempts to show the relationship and bring clarity to the subject were noble efforts but they just won’t fit into a feasibility document reviewed by bankers, political leaders and of course the public. If you’re not convinced there’s an oversupply problem which has a material effect on your center’s performance, consider these facts:

  • The event industry is growing and only a small fraction of convention centers can consistently boast above 50% occupancy, so there’s lots of vacant space.
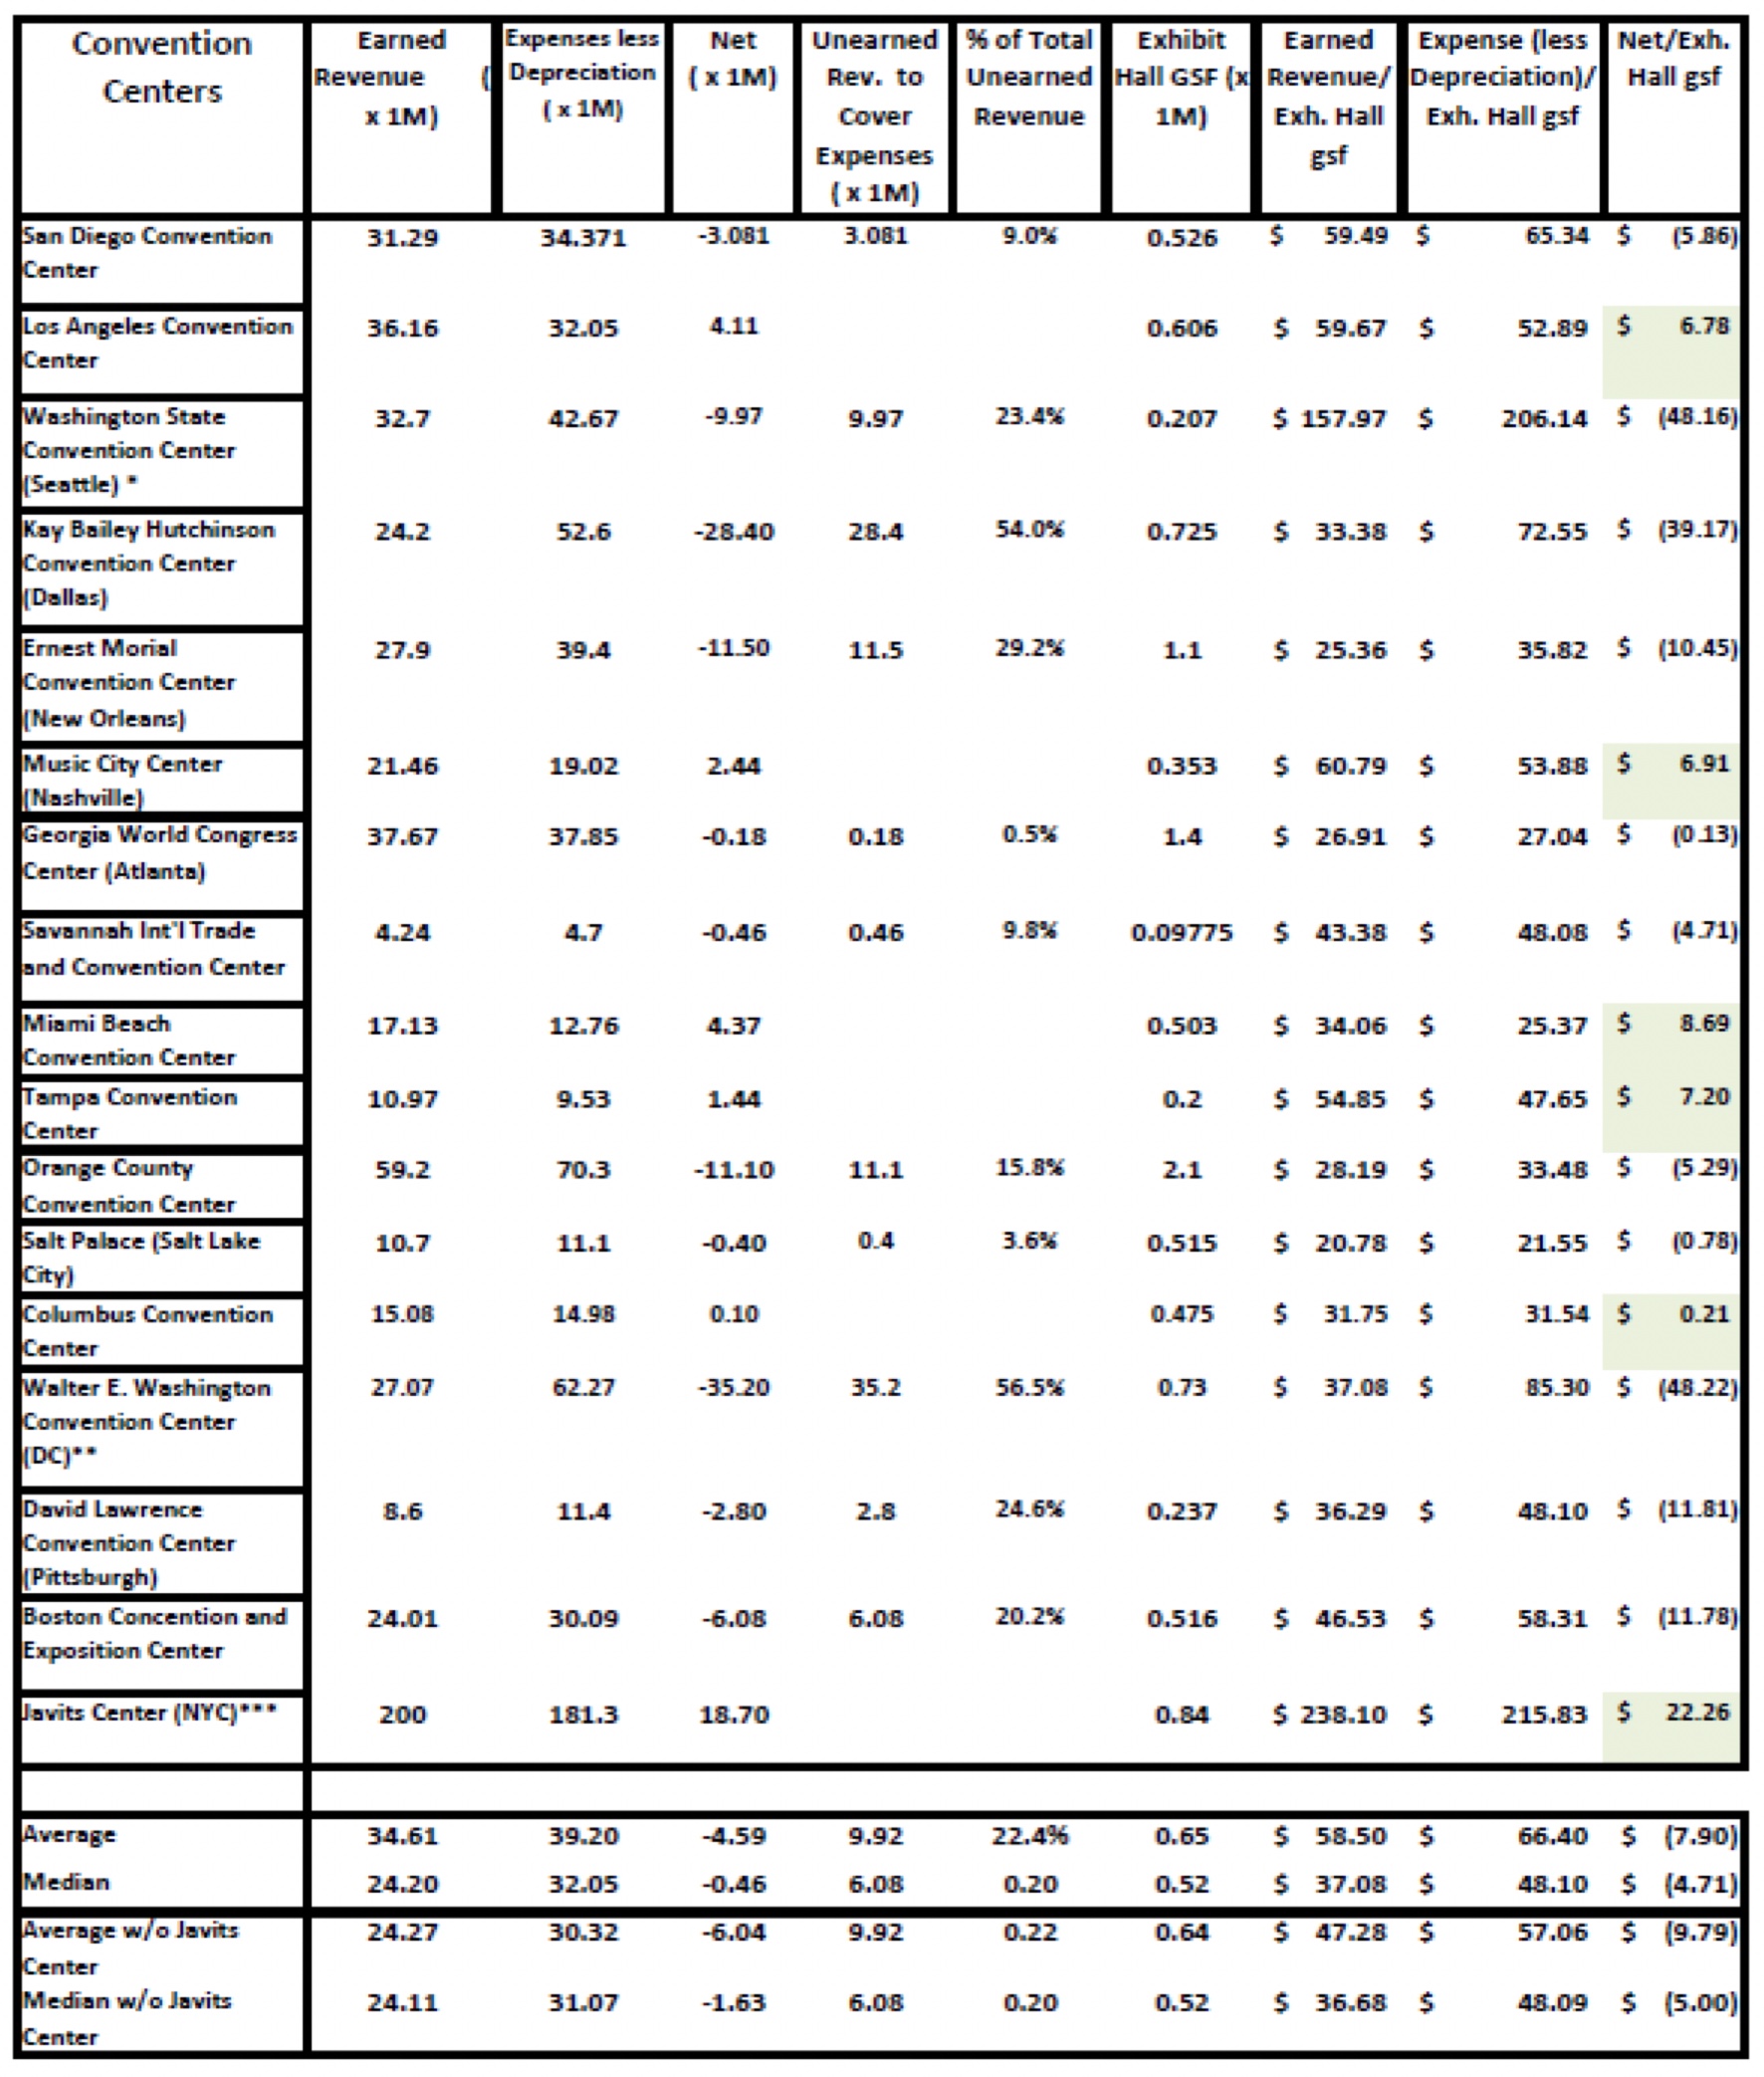
  • Falling prices is a marker for oversupply. Oversupply is not uncommon. It extends beyond commodities like wheat, corn or oil. It extends to finished goods like LED lighting where prices have fallen 40%. It extends to convention centers too. Convention centers are still deeply discounting or dropping rent charges to keep market share. You might expect that revenues at convention centers would rise in concert to the revenue increases seen and forecasted in shows. They have not. Most are declining.

How Did This Happen? Why Is There Such a Surplus of Convention Center Space?

Most of us felt there was an oversupply problem 10 years ago. Still from 2005 t0 2015 exhibit space increased over 30%. A vocal critic of new and expanded convention centers emerged in the 1990’s, Professor Heywood Sanders (University of Texas-San Antonio). He focused his attention on the obvious – most of the forecasts from feasibility studies did not happen as predicted. In fact they were highly inaccurate.  He also focused on the methods in which public officials managed to finance convention center projects. His conclusion was that the events such as the 9/11 attack, while material, would not have stopped the poor performance of expanded convention centers even if the attack had not occurred. His premise was that the studies relied on survey data of expectations (opinions of prospective show managers who were interviewed) and not on actual data. Professional statisticians would agree. They would recognize this common tendency to ignore prior history when making important decisions. Statisticians have given this tendency a name, base rate neglect. Base rate neglect can occur in any field; engineering, science and business. In business, case studies find most managers depend more on new and highly relevant information, favoring it over the base rate   Sanders characterized the studies as “faulty analysis, erroneous conclusions”. Professor Sanders had and still has powerful disciples. Business writers from well known publications weighed in. Business writer Victoria Murphy wrote an article in the Forbes February 2005 issue “The Answer Is Always Yes”. In it she took aim at the Oregon Convention Center:

Today, $116 million in bricks, mortar and carpeting later, Portland’s trade hall is struggling. It lost $5.5 million last year on $15.3 million in revenue. Occupancy since the expansion has fallen from 71% to 43%. The Wood Technology Showcase, a Portland event for 34 years and one that expansion boosters cited as needing the enlarged venue, has been postponed because of lagging attendance. The same run-down buildings and third-rate restaurants that always surrounded the center, like Burgerville and a deli that sells sushi and Beanie Babies, are still there.

“We haven’t set our sights on being profitable,” says Oregon Convention Center’s executive director, Jeffrey Blosser. “These are challenging times in our industry.”

Challenging? The business is a mess, plagued by a taxpayer-funded burst of expansion and a continuing dearth of customers. Over the last decade cities’ annual capital spending on centers has doubled to $2.4 billion, according to a study by the Brookings Institution. The projects are frequently backed by expensive feasibility studies from consultants that rarely give a thumbs-down. Forty-four new or expanded halls are in the works, in hot spots such as Las Vegas and not-so-hot spots like Albany, N.Y. Seven million square feet will be built in the next few years, adding to the 64 million square feet now standing.

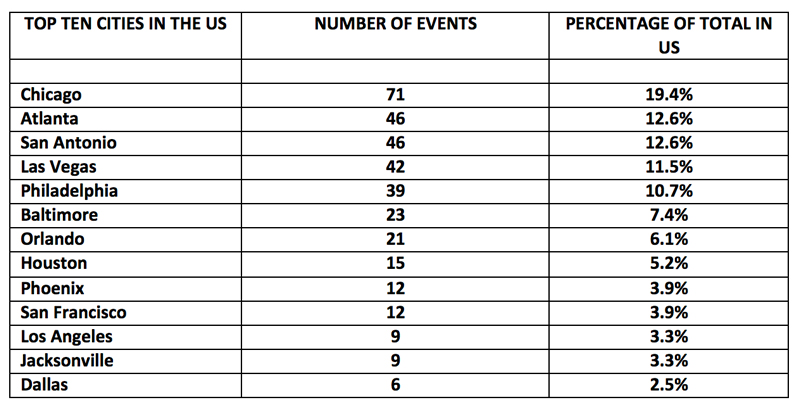
Unmentioned at ribbon-cutting ceremonies is that the space will be impossible to fill. The biggest 200 shows, a rolling list measured by Tradeshow Week, are using the same amount of space they did in 1992. Attendance has fallen at most centers, even those with new space such as in Indianapolis, Chicago and Atlanta. The thriving destinations, Orlando, Fla. and Las Vegas (which just announced a $400 million expansion), are stealing smaller shows away from other cities, stuffing in several at a time. The smaller trade halls are discounting, even giving space away.

….. By the end of 2004 the center’s finances were in bad shape. To get 34 decent-size shows, the center had to indirectly waive rental fees for the organizers of 10 of them. The building would have lost $15,000 a day if not for $6 million in tax subsidies. Hotels are 60% occupied, as fewer than 30% of convention-goers last year came from outside Portland.

The fix, says center director Blosser, is a new 600-room convention hotel, backed by the city. “We lose a lot of shows because we don’t have a big hotel. But it doesn’t pencil out for a private company; a hotel here would need help,” he says. Blosser commissioned Strategic Advisory Group, an Atlanta consultancy that specializes in convention center and hotel studies, to assess the idea. SAG says the new hotel will bring in annual spending of $116,000 per room.

Maybe Blosser should run those numbers past the folks in St. Louis. In 2003 St. Louis followed a $270 million convention expansion with a 1,081-room, $265 million adjacent hotel, paid for with public and private money. Hospitality Consulting Services projected 800,000 room-nights per year citywide with the addition of the Renaissance hotel. Instead St. Louis is getting only 400,000. A nearby McDonald’s closed shop. The neighborhood remains lackluster, punctuated by a store peddling gold chains and a discount sneaker outlet.

In August Moody’s downgraded the city’s $50 million hotel bonds even deeper into junk. The development group will likely have to drain the $5.7 million left in its reserve fund to service the debt and come up with additional money from stakeholders like Kimberly-Clark. “The assumptions that go into feasibility studies are the problem,” says Anne Van Praagh of Moody’s. “The outside firms have no financial stake in the business.”

There simply was not enough accurate data to clarify and validate demand and what data there was too often interpreted poorly.  Professor Sanders believes that the consultants should have known better and expanded their scope to include more historical research. He strongly implies that a group of consultants played the game fast and loose. However as I have experienced, what little they presented was enough for the clients. Clients were more inclined to accept positive interpretations of data and research and readily used it as validation to pursue financing and expanding. There were also many other strategic judgments which had to be made beyond the feasibility studies; competing  for tourists and business tourists among cities, creating a means to better distribute the tourism dollar to include seasons which are not traditionally vacation time, bolstering the tourism physical infrastructure, creating steady service industry jobs to working class and immigrant citizens, etc. Enlightened city leadership sees the role of government to invest in those things that are going to support an economic and social strategy for the future. Building the kind of facility that will enable a city to attract and accommodate the kinds of business, academic, professional and investment-related activities that support such a strategy is more of an obligation than an indulgence.

Other Observations, Inferences and Theories

Yes, in hindsight there were some poor decisions made in the 1990’s and early 2000’s regarding expansion. We know that now. However, some extraordinary world and national events took place during this time which seriously impacted the performance of new and expanded convention centers:

  • The internet/IT boom and bust cycle – Certainly everyone took notice when COMDEX was sold in 1995 for $800 million. Many, including convention centers in Las Vegas, New York, San Francisco and other cities profited also. The boom cycle lased for about 5 years. New concepts in technology meant new shows. Large horizontal IT events would spawn vertical shows which would often play at smaller venues. When the market bubble burst in 1999/2000 it was a shock to all venues that had relied on technology trade shows. Some consultants advised their convention center clients that the downturn would be short-lived based on the recent short recession in the early 1990’s. Things didn’t turn out that way. Then:
  • The 9/11 attack – A general malaise settled over the industry, business travel slowed to a crawl, attendance dropped, shows cancelled and other marketing channels were emerged
  • Structural changes in marketing communications – Certainly the rise of on-line advertising, shopping and buying had an affect on trade shows and conventions.
  • The on- set of the Great Recession 2008 – The pace, the acceleration of business and banking failures, and the loss of market value hit worldwide. Of course this would affect the convention and tradeshow industry profoundly.
  • The expansions that took place in the last 10-15 years were either under construction or were in some way committed to proceed. They faced enormous impediments given the events listed above.

Critics and doomsayers of convention center expansions apparently believe that growth industries should be buttoned up and tidy. They are not; they are disorderly and at times chaotic. They have conservatives influences and risk takers. In a highly competitive industry risk takers usually come out on top. Critics should stop and take a top down long view of the convention center business and consider the normal risk factors and business cycles that can and do occur in nearly all growing business sectors. . The consulting firm HVS, explained it best:

As an established industry, continued growth in demand will come not from latent sources, as occurred during the last few decades. Rather, industry growth will depend on new demand, which is affected by numerous factors such as the cost of travel, the importance of face-to-face interaction in certain industries, improvements in facility design, resources available to promote events, trend in how firms allocate their marketing budgets, and overall growth trends in the national economy. In most industries that go through periods of overbuilding (e.g. hotels, residential, shopping malls, and office space), the ability to generate private return on investment eventually limits the expansion of supply. Since most convention facilities are publicly financed, this market discipline is not necessarily present. Instead limited resources of governments and the public decision making processes that consider the merits of capital investment place limits on supply growth. In our experience, most municipalities are not “willing to try almost any investment in their quest for more convention visitors.” Concern over the proper allocation of limited resources and historical experiences of success and failure play very important roles in the decision making process. Which brings us to a point of agreement with Sanders’ overall conclusions: careful and realistic consideration of the chances of success should inform the public decision making process about investment in convention centers” Concern over the proper allocation of limited resources and historical experiences of success and failure play very important roles in the decision making process.

Expansion project costs are normally quite high but sometimes a good fraction of the financing is not related to expansion of sellable space. Rather, the financing is used to pay for deferred maintenanceDeferred maintenance can be extensive preventive maintenance, corrective maintenance, system upgrades, or repairs that are deferred to a future budget cycle or postponed until funding becomes available. Civic pride, competition among cities for event market share, the city planning practice of creating an anchor or destination spot within cities have caused the construction of massive structures with expensive architectural features and finishes. Many of these building elements and systems are expensive to replace, repair and renovate. They are generally of high quality and durable, reducing the risk of failure. They become easy to defer, repairs are expensive and they can wait. An extreme example is the Javits Center’s recent $453million expansion only saw a very modest increase in exhibit space and virtually none in meeting rooms. Rather, 70% of the funds were used for completing deferred maintenance projects for the roof ( which had legendary leaks since the center was built), the curtain wall and roof glass which had gone beyond its useful life and the HVAC mechanical plant ( 8,000 tons of air conditioning capacity supplied by roof top package units). I believe other convention centers face similar problems. Deferred maintenance costs build and compound year to year, while municipal or public authority budgets typically drop these line items year after year. They don’t go away and eventually expose themselves with building problems which can affect business. How big can they get?  As an example, there is a benchmark for US universities on deferred maintenance – about $3.50 per square foot. Apply that to the square footage of your convention center. Convention centers should know before they build how deferred maintenance costs will affect them in the future. Designers should do a life cycle costing of major systems before construction. Often the most reasonable solution is to attach the deferred items in a bond issue to finance expansion.

Recommendations

Our industry is beginning to sober up regarding expansion feasibility studies. From the few I’ve read which were written since 2013, I’ve been most impressed with The Strategic Advisory Group’s Colorado Convention Center Feasibility Study (released in 2014). The presentation is crisp with plausible explanations. The study adheres to the principle of measurement validity, i.e., how well the results of a study measure what they are intended to measure. The measures are relevant and are not lost in statistics which are only material if the study was on a national scale, not just Denver. While surveys of existing and prospective clients were done, the report defers to statistics, principally occupancy and occupancy’s sub-sets. There’s a certain elegance to that. It speaks unvarnished truth and it is all encompassing; all other performance measurements are derived from occupancy.   Further it discusses vertical industries and their events which might have a connection to Denver and the Rocky Mountain region. The report examines “city –wides” and effectively explains them in occupancy terms. Lastly it takes the time to discuss the cities brand and tourism attributes and compares them to competitors. The convention center’s venue characteristics are important but the foundation of a favorable brand, a place that people emotionally connect with comes first. For convention centers about to launch a feasibility study read this one first.

If I were a convention center manager about to contract with a consulting firm for an expansion feasibility study, here’s the scope of services I’d ask for when composing the sales and marketing section:

  • A narrative including tables and graphs of convention centers’ current position with respect to size and growth and the event industry’s size and growth. If information can be obtained about the #, size and growth of corporate events include that also.
  • Obtain the following statistics:
    • A history of my center’s occupancy for at least ten years.
    • Breakdown the occupancy by month, exhibit hall, meeting room suite and ballroom, and by type event (tradeshow, consumer show, entertainment, banquet, social gathering, corporate meeting, product roll out, film and photo shoots, etc), by industry sector (medical, financial, consumer goods…..)
    • A history of the net to gross square footage percentage for exhibit halls
    • A history of occupancy for regional and national competitors
    • A history of event attendance (note attendance figures that are audited) by type event and by industry sector)
    • A comparison of physical plant characteristics with competitors ( size and number of exhibit halls, meeting rooms, ballrooms) , age, configuration (facility map)
    • A history of annual revenue and expenses broken down
    • A history of revenue earned per square foot (electric/plumbing, telecommunications, cleaning, F&B, etc.) earned annually and by event type and industrial sector
    • A history of competitors’ annual revenue and expenses broken down
    • A description of hotel inventory – #, rooms, committable rooms, brand mix, distance from center
    • A description of restaurants, nightclubs, concert venues in and around the hotels and convention center
    • A description of the airport ( # of direct flights to certain cities, annual passengers, etc.)
    • A comparison of city brand and reputation with competitors from an economic or social research organization such as Bloomberg Business, the Miliken Institute, The Reputation Institute, and others. Develop a composite rating


  • Describe the verticals that occupy the center and include verticals that have events at other city venues. Characterize whether the verticals are or are not a reliable prospect.


  • Closely examine the Lost Business reports for the past 5 years. If you consider them unreliable then insist that they be re-visited. Differentiate between turn-aways because of lack of space and /or time of year or days of week and lack of certain services, from service quality, from pricing issues and from destination issues ( such as the quality of hotels, the city crime rate, the city’s overall reputation, etc.
  • Develop a list of new prospects and assign priorities based on probabilities of a booking. Do not simply make generalizations about the size and growth of the market and through a judgment call contrive a number of new events
  • Construct an Occupancy Model for 3 years forward. Put it in a calendar form and footnote each event with a probability.

I would consider the above phase 1. of the study. There is no need to go further with an economic impact evaluation if the above is unfavorable.


Perhaps you just received a feasibility study for a sizable expansion. Need a second opinion from a team that’s been there and done that? We can conduct a peer review of your feasibility study and point out strengths and weaknesses. These decisions are matters of trust.  Consider MTMConsult, LLC . 

Email us at advisor@conventioncenternow.com  or call – 203-273-6999


Consumer Shows – A Fresh View at an Old Topic

Most US cities have elected to have the CVB organization control the long term event bookings at municipal or state owned convention centers. The CVBs dutifully pursue events which naturally bring in the most out of town visitors. In doing so they “hold” time and space for the best prospects and discourage active pursuit of less desirable ones. Convention center sales teams are generally free to pursue events that don’t require long term reservations of dates and space. In this model however, little long term security on space and dates can be offered to events that cannot demonstrate high numbers of out of town attendees. Trade shows which may fall into this category and regard your city as a strong market draw will look for alternatives. It is likewise for consumer shows, which simply won’t rotate to your city or will choose a less prominent venue. Know that trade and consumer shows normally count on for four things before making venue commitments; date reliability, space reliability, financial predictability and theme protection.

The Javits Center Experience with Consumer Shows

I believe the Javits experience from 1995 to 2008 is instructive and relevant to other cities with CVBs and large convention center management teams. In my time at the Javits Center the sales and marketing arrangement was not as described above. Javits controlled its own bookings. Our board policy and directive was and probably still is to create a sales model that hosted events which brought in out of town attendees. However, there were understood conditions to this directive which, while not formally disclosed and publicized, were fundamental business tenets:

  • The Javits Center received no subsidy to help pay annual expenses. Revenues had to meet or exceed expenses and we always achieved that goal. Javits management and Board of Directors never acknowledged or endorsed the now fashionable concept that convention centers are not designed and built to make money.
  • Management recognized that high occupancy was key to building revenue base and understood that it was near impossible to achieve 50% occupancy without having annual recurring events. Consumer shows represented about 10% of Javits occupancy annually. Javits occupancy from 1997 through 2008 always exceeded 65%. In 3 of those years Javits exceeded 70%.
  • The Javits sales and marketing approach viewed certain economic sectors as natural fits for the city. These events were recurring and would pay the license fees and expensive labor and service costs because it was in their best interests to stage their event in New York City. The NYC/CVB would argue that booking a large professional association meeting may bring 10,000 hotel room nights whereas a fashion, luxury goods or pharmaceutical trade show would only yield half of that.
  • Javits had a different point of view than the above. Javits regarded the recurring shows (trade, association conventions and consumer shows alike) as annuities, something we could count on for a consistent measure of hotel room nights and revenue. Javits management lacked confidence that different large association bookings could be repeated year to year and we had certainty we were correct. The probabilities were simply too low. Also, the association RFPs which we did collaborate on with the CVB were all based on price. After 9/11 many of the license fees of competitors were often negotiated down to zero and many still are. It was in Javits best interest not to compete on that basis. For associations which had a genuine interest in New York City, especially during months of soft demand or where retained clients had flexibility, both NYC/CVB and Javits management usually worked out a suitable deal without an RFP process.
  • The relationship between the NYC/CVB and Javits was always cordial and professional despite differences of opinion. Occasionally certain dialog would raise tensions and it normally occurred surrounding the NY International Automobile Show, the largest consumer show at Javits. Public officials or hotel management would publically suggest that NYC/CVB control of long term bookings would be a better method of conducting business and bring in more out of town visitors. They’d naturally point to the Auto Show which took 17 days out of the event schedule during a prime convention month. For Javits the Auto Show represented 4-5% of annual occupancy and 12-17% of annual revenue – the thing spoke for itself.

For years it was my belief that CVBs marketing and sales efforts were more aspirational than realistic. I believe   now that the Great Recession has had a real sobering effect on convention center management and CVBs alike; there is not enough demand for professional meetings and tradeshows to fill the growing exhibit and meeting space supply and, rising operating deficits and subsidies are coming under greater scrutiny by board members, politicians and the media. These matters and other trends have caused more interest in consumer shows.

A Look at 2nd and 3rd Tier Cities and Convention/Exposition Centers

Any professional tension between CVBs and convention center sales teams all but disappears in second and third tier cities, where the annual event schedule is heavily populated with consumer shows. Indeed in the sample we took some convention centers had more than 50% of their major events as consumer shows. These events are relatively easy to setup and move out, ideal business for weekends. Regrettably the preferred week day business of professional association meetings, business conferences and trade shows are hard to obtain in the face of so much competition.  Consumer shows therefore have become the core business by circumstance rather than design. They are material contributors to occupancy rather than occasional ”filler” business – an extra source of revenue. Below are the types of consumer shows and monthly distribution for 2nd and 5rd tier cities from our sample:

2nd3rdTierCitiesConsumer


2nd3rdTierCitiesConsumer2

For smaller cities, many of the consumer shows are owned and run by small operators. The events tend to be highly programmed and formulaic and for some events there is a tendency for the event to become stale. Some consumer show managers have recognized this and now include celebrity appearances and expert demonstrations as part of their event program; Home and Garden events have celebrities from HGTV and Food & Wine events have celebrities from The Food Network doing live cooking demonstrations. There are these and other notable exceptions where a consumer event can attain a stature capable of attracting out of town attendees and achieving an impressive level of popularity. Six years ago these shows were described by Tradeshow Week writer Lisa Plummer as “passion events”. In the article she explained,Representing various segments of the hobby and interest marketplace, these events boast enthusiastic fans so devoted to their pastimes they’re willing to spend discretionary income, no matter how limited, to attend.” Clearly these events don’t just happen. They are the product of well funded, creative show organizers who know the right formula to draw exhibitors and attendees. They typically follow an important rule of thumb; the more focused the event and the more committed the consumer, then the more resilient and successful the event. Their interest is more easily maintained than attendees at broad-based events, which, by contrast, can suffer sharply during an economic slowdown. The two examples are below are illustrative of this type of consumer shows taking place in smaller market areas:

  • The Iowa Deer Classic – Held each year in Des Moines at the HyVee Hall & Vets Auditorium, it’s characterized as a “deer hunter’s heaven”.  The 25 year old exposition brings in around 300 exhibitors – some of them are from places remote from Iowa; Africa, New Zealand, Canada and all over the US. Products from all over the world accompany the exhibits too. It’s the ideal event to popularize new brands. More than 25,000 enthusiasts attend from Iowa and all the neighboring states. The event has contests, demonstrations and educational sessions by well known experts and live entertainment. Ticket prices are very reasonable. The owner’s passion (Iowa Show Productions, Inc.) is well directed and evident in the success of the event. Des Moines has a population of just over 200,000.
  • America’s Largest Antique & Collectible Shows – The owners, Palmer/Wirfs & Associates, hold six events each year in Portland OR (pop. 620,000), Puyallup (pop.39,000; nearby Tacoma pop. 200,000) and Clark County WA (pop. 450,000). Recognizing that antique collecting has is an expensive pursuit, the events are designed so that, as owner Chris Palmer explains, “Attendees can arrive with limited dollars and leave with treasures. There’s a direct connection between what you see on the show floor and most people’s lives,…. people recognize things as being part of their childhood or their grandmother’s childhood. If a hobby is a valued part of one’s lifestyle, most people will prioritize their spending to pursue that passion, and likewise, attend an event that celebrates that interest.”  Their two largest shows have over 1,000 exhibit booths and draw 16,000 attendees each. The owner’s were insightful enough to recognize a consumer niche and exploited it.

A Look at Top Tier Cities and Convention Centers

In my mind the one consumer show that stands out as the winning model for its size, attendance, public support, cultural value and fun and amusement is The Paris International Agricultural Show  (Salon International de l’Agriculture). The show is 9 days long and the last show had 691,038 visitors and 1,050 exhibitors. Each year it’s held at the Paris Expo Porte de Versailles starting at the end of February extending into March, just as Spring is about to arrive. The show is part festival, exhibition, consumer market and cultural celebration, and no doubt quite profitable for the event owners and managers and the Paris Expo.

There are some US consumer shows which are comparable and have worldwide stature too:

  • North American International Automobile Show – Cobo Hall – Detroit – 815,575 attendees
  • Miami International Boat Show – Miami Marine Stadium Park & Basin – 96,000 attendees
  • The Philadelphia Flower Show – Pennsylvania Convention Center –Philadelphia – 250,000 attendees
  • Art Basel – Miami Beach Convention Center – 70,000 attendees

And relatively new:

  • Gen Con – Indiana Convention Center – 197,695 attendees
  • Comic Con International –San Diego Convention Center – 130,000+ attendees
  • New York Comic Con – Javits Center – 167,000 attendees

Consumer show operators could only obtain these attendee numbers in cities with population exceeding 1 million. They also take into account the number of potential attendees within a 3 or 4 hour drive time. Success for these events is also measured in terms of out of town attendees who stay at hotels. The 2015 Comic Con International Show had 59,228 hotel room nights and an overall economic impact of $135, 900,000 to the city. This makes consumer shows with the size and stature of those in the list above competitive with major association meetings. Important to note also is that the consumer shows are normally recurring in the same city and venue.

The percentage of consumer shows to total major events at large convention center in top tier cities is between 15- 20%.

Beyond Passion Events – The Emergence and Power of the “Cons” and Pop Culture Shows

No doubt some of you read the Wall Street Journal article “The Rise of the Cons” March 3rd 2016 by Ellen Gamerman. If not, it’s worth reading. An excerpt from her article appears below:

The industry of the ‘con’—short for convention—offers what the Internet does not: face-to-face experiences, custom swag, exclusive sneak peeks and the bragging rights that come with traveling to the spinning center of a pop-culture universe for one intense weekend. The con business also is fueled by what the Internet does best, as organizers use social media to draw crowds and mine data to predict what audiences will want next.

The beating heart of the empire is the comic con, which has morphed steadily from scattered niche events for comic-book lovers to broad pop-culture fests embracing every entertainment genre. In an effort to capitalize on recent growth, international event-planning firms have been buying up mom-and-pop cons, starting new events and diving into unexplored markets. ShowClix, a platform for live-event organizers, tallied 519 major pop-culture fan gatherings in the U.S. last year, up from 469 in 2014. The 50 new events entering the marketplace in 2015 are more than double the number of debuts in 2009.

In 2006, Comic Con was already a hit in San Diego when Reed Expositions approached the Javits Center about obtaining dates and space for a comic book event. October dates were valuable to us so the prospect of a Comic Book show held only a passing interest. Greg Topalian who was with Reed at the time was persuasive and I elected to fly in to San Diego for a look. And that’s all it took was a look and a quick walk through. Javits booked NY Comic Con. The quirky off-beat show that worked well in San Diego would certainly prosper in New York. The event has been at the Javits Center since and grown each year, now 167,000 attendees. For the Javits Center and no doubt any other large convention centers hosting a major Comic Con type event, the revenue opportunities are substantial. The show floor is populated with exhibitors such as major movie studios, television networks, recognizable publishing companies, automobile manufacturers, and software and telecommunications companies. Many have island booths and all build sophisticated exhibits with high value electric and telecommunications services. Add to that, F&B concessions and restaurant revenue and you have a top revenue producing event.

Despite the success of these shows, some experts see an over- heated followed by burn-out market coming with the Comic Con and Anime brands over saturated. If the Showclix event directory is correct, the trend points towards over 600 such events by 2017. Naturally some experts point out that serious fans already call the shows too generic, commercialized and overcrowded. The business writer Rob Salkowitz predicted that, “If the hard-core fans go, so will the exhibitors who cater to them,” he said. “Then what’s left? Cons just become another consumer event.”

The “Cons” phenomenon is not exclusively tied to comic books. The Wall Street Journal article discussed cat shows or cons, beer cons, fitness cons, quilt cons and others. Cons represents is a differentiating experience in a public setting; an opportunity for hobbyists and enthusiasts to gather and interact in a unique quirky environment which above all is fun. The creators of these events have not stumbled upon the latent demand for these shows just by intuition. There is a science behind it. The leading corporate event company Jack Morton Worldwide produced a whitepaper in 2015 entitled  “What people will want from brands in 2015”.  The paper is based in part on what neuroscientists and cognitive psychologists describe  when an event  attendee’s  full range of senses are stimulated –  the more memorable the meeting experience will be for them, because more parts of their brains are activated. Creators of Cons well recognize that attendees don’t just want to look or hear; they want to interact and stimulate their senses of touch, smell and taste when they visit a destination. The good Cons fulfill that need.

zombie

Another Con worthy of mention is Gen Con. In 1967 Gen Con began as a competition of war game enthusiasts in Lake Geneva, Wisconsin. The event derived from its location, the name Gen Con is a shortened version of the original name “Geneva Convention”. Gen Con’s roots grew from historical war gaming popular in the 1960s.  Over time it expanded to support all categories of hobby games and family entertainment. Game categories include traditional and collectible card games, board games, role-playing games, live action role-playing games, miniature war games, computer and electronic games, and hybrid games. The show is geared to an “all age” format; and with so many individual events, the show caters to youth as well as those young at heart. In 2003, Gen Con moved the U.S. event to Indianapolis, Indiana. The relocation was a resounding success. Below is a graph showing Gen Cons annual attendance history. In 2015 attendance was 197,695; this is explosive growth. The graph is instructive because it depicts the power of Cons and what can be achieved. I can imagine a graph of similar nature for San Diego and New York’s Comic Con.

chart1

IndianaCC

Q. E. D. – A Review of Consumer Show Value

  • Consumer shows contribute to convention center occupancy and revenue in a material way and, because they recur year to year, do so consistently. For 2nd and 3rd tier city convention centers consumer shows are essential for financial health.
  • Consumer Shows improve weekend occupancy which is historically low in most large urban convention centers
  • Although there is security sticking with consumer shows that keep with the enduring themes such as  cars, home and garden, crafts, collectibles/hobbies, etc., some creative show managers have taken these themes and provided more edgy focused programming, concentrating more on the consumer demographic and consumer desires. They have stepped things up a notch or two and have demonstrated that the reliable show themes do not have to be so ordinary. Researching properly and finding the better show managers who produce consumer events that have the passion element to them will produce a higher quality event. These exceptions are known to achieve a stature capable of producing more revenue, attracting out of town attendees and attaining an impressive level of popularity among local residents. 
  • There is another genre of events which has acquired the label of “Cons”. Their ability to attract huge attendance consistently while also exceeding event revenue and out of town visitor goals is noteworthy and remarkable. Creators of these events find hip or cutting edge trends and artfully exploit social media. They seek out venues in cities and regions which have the right mix of population density and a demographic quality which Greg Topalian, President of Left Field Media, described as a level of “geekiness”. Others have called the phenomenon “niche fandom”. For these “Cons” the attendance numbers and the rate of growth for these shows has not diminished.

Recommendations

  • For convention center management and sales teams where the CVB controls long term bookings and as a matter of policy avoids and discourages consumer shows – take the time and re-educate the CVB on the changing nature and value of consumer shows
  • Don’t just settle for the consumer show line up you have. Research the current show themes that now play at your convention centers and see what others are doing. Creative things are happening to old themes.
  • Once a good prospect appears, insist on some date flexibility before closing. You don’t want to turn away association and convention business nor lose a consumer show because of fixed dates.
  • Don’t get too cozy with consumer show managers and be mindful if others (board members, politicians, etc.) are. The NY Boat Show issue which occurred in 2013 is a good lesson learned. Fortunately that issue was settled with a reasonable compromise but not without controversy
  • Study and stay abreast of what’s happening in the “Con” world. Talk with them, they are very approachable.


Learn More About How Statistics Can Shape Your Marketing Plans

Download our two White Papers (now offered at no charge):

In the Pursuit of National Medical/Health Science Events – A Primer Focused on Convention Centers

Booking National Religious Events – A Primer for Convention Centers on How Event Location Decisions Are Made

Visit    http://www.conventioncenternow.com/white-papers

Knowledge Hubs and Creative Clusters – How Convention Centers Can Benefit From and Contribute To New Economic Development

What Are Knowledge Hubs and Where Are They?

They go by many names; knowledge hubs, brain hubs, innovation centers, creative clusters, magnet cities.  Social scientists call the field economic geography. Economists have come up with means to measure the relative strength of this special sector (the knowledge sector) which are beyond base employment and contributions to regional GDP. Now these areas and locations are mapped and ranked by number of patents issued annually (see 2011 map below) and the annual churn in venture capital investment and R & D investment.

Knowledge-Hubs-CCImage
CITYLAB, October 9, 2013

Indeed these places are defined by intense entrepreneurship.  The concentration of related technology firms includes competitors, suppliers, distributors, service companies and customers.

Let us assume that technology and business demand exists along with a solid foundation of human capital (university educated and trained engineers, scientists and mathematicians), job security, opportunities for career success, and a vibrant progressive living environment. Case studies and academic papers show that some knowledge hubs get a head start with government incentives – through tax incentives or zoning for special districts where start ups can locate. There are other factors too that help drive a hub’s success:

  • A connection with a university or research institute nearby, where facilities can be used and there is access to the university research, knowledge and talent base. Some universities have technology transfer and “commercialization incubator” programs offering business, legal and technical counsel.
  • Access to venture capital firms which appreciate all the attributes and habits of knowledge hubs
  • Marketing and branding support from state and city economic development organizations. Also hub companies should count on similar support from a hub organized association which focuses on the growth and success of the hub and is well connected to other global industry organizations.
  • A community that fills the social needs of a young skilled workforce – nearby affordable residential, better than average amenities and services and an active entertainment and sports culture.
  • Meeting Places – Most of the literature about knowledge hubs describes the importance of “knowledge spillover” (called cross-fertilization by some). Also described is the ideal setting for this to occur which is an event venue. These can be formal or informal places such as cafes, restaurants, sports and cultural facilities. They can also be a convention or conference center with A/V, high speed internet and F&B services. These environments are deemed essential for the frequent and free exchange of ideas and collaboration. This increasingly includes the promotion of more formal and informal events, ranging from forums to workshops to a simple social gathering.
  • Rock Stars – It helps a great deal to have a renowned scientist or business person associated with the hub or with an anchor company in the hub. This should be someone who has made a name for themselves and can lead and inspire others. Would Silicon Valley be the knowledge hub beacon that it is without Steve Jobs, Larry Page, Sergey Brin or Mark Zuckerberg?

The types of industries represented and the cities and regions where knowledge hubs reside and thrive have become familiar to us all:

  • The San Francisco Bay Area (Silicon Valley) – By far the best known concentration of knowledge based industries, this area’s popularity started with the development of transistor technology, followed by silicon chip innovations. The area is now well into internet use and applications and of course mobile communications devices. From a technology point of view, the Silicon Valley cluster or knowledge hub may be viewed as multiple, overlapping and ongoing technology initiatives. For example, Silicon Valley has seen a cluster of technology evolution across semiconductors, computing, software and information technology, and entertainment media.There are several renowned universities in the area (Stanford and UC Berkley among them).The entire area is in fact a metaphor for growth and success in the knowledge sector. To show the strength of this region, the map above depicts 14,811 patent applications for the Bay Area, where New York had 6,181, LA – 4,766, Seattle – 4,802 and Boston- 4.089.
  • The Boston Area – The Route 128 corridor area is often compared to California’s Silicon Valley. Media often call the positive effects of this growth on the Massachusetts economy the “Massachusetts Miracle“. Its development was driven by technology out of Harvard University, MIT, Tufts and many others universities and institutions. IT companies located there include IBM, Microsoft, EMC and others.In Cambridge lies the heart of Boston’s booming biotechnology industry. As it was once described, “That kinetic energy of having everybody squished together — it leads to a lot of advantages you can’t get outside the city.” The Boston-area biotech community is among the largest and densest in the world, with Kendall Square at its epicenter. The neighborhood squeezes 120 biomedical firms within a 1.5-kilometre radius. The density and diversity of the biotech ecosystem make Kendall unique; the area is home to biomedical firms large and small, but also to the investors, patent lawyers, contract research organizations and suppliers they need to support them.
  • North Carolina’s Research Triangle – Situated between the cities of Chapel Hill, Durham and Raleigh one of the more prominent knowledge hubs in the country has developed. The hub is anchored by a mixture of high-tech start-ups and Fortune 100 companies such as IBM, SAS Institute, Cisco Systems, NetApp, Red Hat, and EMC Corporation, In addition to high-tech, the region is consistently ranked in the top three in the U.S. with concentration in life science companies. Some of these companies include GlaxoSmithKline, Biogen Idec, BASF, Merck & Co., Novo Nordisk, Novozymes, and Pfizer.  Three well known research institutions are nearby, Duke University, University of North Carolina at Chapel Hill, and North Carolina State University. This thriving hub of innovation is home to more than a dozen pioneering industries including biotechnology, pharmaceuticals, clean technology, and information technology. The “Triangle” name originally referred to the region’s universities whose research facilities and highly-educated workforce served as a major attraction for businesses

There are of course many other locations which are models of knowledge hubs; Austin and Seattle for software development, San Diego for biotech and telecommunications, Washington DC for biotech and health science,  Sacramento/ Davis California for agro-tech, Vancouver for clean energy tech, Albany NY for nanotech. The table below is from the on line publication City Lab. It shows the top ten metros for creative-in-traded employment. Creative In traded employment is a term used for creative work which can be exported from the region. This is opposed to in – traded local which are service jobs for inside the region. In earlier discussion the San Jose-Sunnydale-Santa Clara metro is combined with San Francisco-Oakland-Hayward.

Knowledge-Hubs-CCImage2


What Is It About Knowledge Hubs that Differentiate Them from Other Historical Economic Development Clusters?

Clusters are not a new phenomenon. In Europe, watchmakers clustered in Switzerland and fashion designers in Paris. In the United States, well known clusters include Detroit for the automotive industry, Hollywood for movies, and New York City for financial services and advertising. So why are today’s employment clusters so different?  The UC Berkeley economist, Enrico Moretti, has noted distinct differences:

  1. About two thirds of US jobs are in the local service sector, anything from waitresses to store clerks to teachers, lawyers and doctors. These jobs make products and perform services that are locally produced and consumed. Global competition does not affect them very much. But while these jobs are the major source of employment, they are the effect and not the cause of economic growth. Productivity in the service sector generally remains the same year to year. Moretti calls these “non-tradable jobs” (also referred to as In-traded local jobs) because they cannot be exported outside the hub region.

    Productivity in the knowledge sector however continues to increase at a healthy pace each year. Every sub-sector has grown; software, biotech, scientific R&D in manufacturing, chemical and material science, robotics (related to advanced manufacturing), agri-tech, nano- tech, digital entertainment, clean energy tech and on and on. These are creative In–Traded jobs and their products can be exported. New technological advances are their product and it is this sector that drives the local economy – creating the need for more service sector jobs, higher wages and general prosperity. What happens in the knowledge hub has a profound effect on local salaries whether the job is part of the knowledge sector or not. 

  2. Traded sector jobs typically have a multiplier effect. An example cited is that an automobile assembly plant causing a shopping mall to be built nearby. Traditional manufacturing jobs generate about 1.6 non-tradable jobs in the service sector. For knowledge hub jobs, research shows the multiplier effect as generating 5 non-tradable jobs in the service sector. This is a remarkable increase. As an example, Moretti cites Apple’s affect in the Bay Area. Apple employs 13,000 directly in Cupertino but has spurred 70,000 indirect jobs in the region.

There are many other differentiators but higher wages and a 5 to 1 multiplier effect are two reasons alone that make the knowledge industry very relevant to the convention and conference center business.

Using Knowledge Hubs to Fulfill a Convention Center’s Economic Development Mission

There is a broad economic development mission for most convention centers:

  • Generate consistent economic impact (in the form of sales tax revenue and permanent and part time service employment) by booking events which attract attendees and delegates who are from outside the city spend money by staying at city hotels, and use local restaurants, shopping and entertainment venues.
  • When convention centers are built in blighted areas, the expectation is that a new convention center will stimulate new commercial development.

Adding a role to the economic development mission to assist in the growth of a knowledge hub is a good fit for convention and conference centers. The 5 to 1 multiplier effect is a powerful economic and political force.  The role can be further defined if the true value of “thought leadership” is considered. In this context “thought leadership” is the art of positioning your city’s knowledge hub as a leader in its field through popularizing and promoting best-in-class research and product development. If conferences are drawn to the area because of hub business and research success, then the convention center’s role will help enhance thought leadership. Hosting hub company meetings (training sessions, product demos, sales meetings, and shareholder meetings) may eventually lead to the development of a niche conference. Having your city’s knowledge hub achieve research breakthroughs and business success will cause thought leadership to take hold. When articles are published about technological advances or business growth of a hub company, the fact that it all originated at your city’s knowledge hub will seem expected. The plan is of course for meeting planners and trade show organizers to consider your city and venue for their larger annual events which draw national attendees.  The meeting and event industry will begin associating your city brand with advanced technology and innovation. When meeting planners are looking for an event destination for an association congress, or a multinational corporation’s innovation forum, or a plant managers’ training trip, at some point the requisite site selection criteria (hotels, transportation, venue space, etc.) will become secondary. This is not because those things are not important, but because they are so fundamental, planners will only source cities where they’re a given. What they are likely to explore more carefully is how a city truly sets itself apart with differentiating and unique appeal to attendees. Here is where a knowledge hub’s depth of technical knowledge, industry expertise, unique research, interesting people and universities can influence an event destination decision. Planners should want to know how these attributes will enhance their event and CVBs and convention center sales teams should have a convincing marketing message.

In the US knowledge hub development has a non-linear quality. The pace is one where growth can proceed at a measured pace to be followed by a burst of accelerated growth only to subside again. Bursts of business activity are normally spurred by the ”next big thing” –  I phones and mobile apps for example.There is a great deal of difference when knowledge hub development is compared to the rest of the world. Just do a Google Scholar search of knowledge hubs and you will find the vast majority of papers and research written by academics in Europe, Asia and Australia.   My impression is that there is a bias for more planned economies. They seem to prefer linear growth with material help from the government. They like things tidy. As an example, last Fall I was on a consulting assignment in Nottingham, UK. My client was interested in convention center development and management. Nottingham does not yet have a convention center. In my time there I was introduced to an ambitious economic development plan established to move the local economic base from manufacturing to a diverse knowledge hub. Nottingham has several areas of potential:

  • The city also has two well known universities which contribute in ways similar to US universities; they share facilities, cooperate and partner on research and share academic and research talent.
  • Nottingham is increasingly developing a niche within the digital content sub-sector. This includes video, film and photography, music, publishing, radio and TV, computer games, and social media. Niches also exist in life sciences sector (medical technology, medical biotechnology, industrial biotechnology or healthcare sectors) and Clean Tech where low-carbon goods and services are produced
  • The government is also actively involved in creation of industry parks for each discipline; Bio City and Medipark for life Sciences, Nottingham Energy Park and Clean Tech Centre for clean tech and the Creative Quarter for other technologies
  • Government activity stretches into investment and finance following a program called “Transformational Finance” with the Nottingham Investment Fund and the Technology Grant Fund.

The economic development plan also made mention of expanding the amount of scientific and technical conferences. There are some conference centers but they are quite small. I had the opportunity to talk with one city official.  We talked in a location where you could view part of the city. From a streetscape above the official outlined an idea to demolish old buildings and build a hotel and convention center. I could visualize it all taking shape as we talked. The possible site for a hotel and convention center bordered Bio City and the Creative Quarter. Time will tell.
Examples of Convention Centers Benefiting and Contributing to the New Economic Development of Knowledge Hubs

No doubt some convention centers and CVBs have identified their city’s knowledge hubs, established contacts and have assigned the knowledge sector high on the list of desirable verticals. There are several success stories worth noting:

  • Boston venues, both convention centers and hotels, will host over 170 conferences, tradeshows and annual meetings in the bio-medical/life sciences sector this year, Boston is the nationwide leader for Medical/Health Science events and clearly the many hotel and convention center venues benefit from and contribute to the bio-medical knowledge hub – a true symbiotic relationship.
  • In Houston, Visit Houston/Houston First Corp. and National Trade Productions (NTP) partnered to create SpaceCom. The first three-day event took place Nov. 17-19 at the George R. Brown Convention Center, capitalizing on an estimated $320 billion global space economy-one that’s growing by the minute.  The impetus for the event was to support Houston’s knowledge hub of space technology. The hub has of course matured a great deal and experienced periods of growth and decline. For many years the hub was in fact a government run operation. New life arrived for the space industry with the commercialization of space transport, the communications networks which rely on satellite communications and applications for advanced manufacturing. Houston took everything a step further than other hub locations by launching their own event where they own the event.
  • In November 2015, the Palais de Congres de Montréal (Montreal’s premier convention center) and Montréal Invivo announced a partnership to attract more international congresses of major health and life sciences in Montreal, at the Palace. Montréal InVivo is an economic development organization dedicated to the creation of a business environment that fosters innovation and growth of companies and organizations in the life sciences sector. This economic development organization brings together over 600 organizations including 150 research centers and 80 subsidiaries of world-class companies, This Montreal knowledge hub has achieved a leadership role in rallying the hub’s players around common goals aimed at ensuring competitiveness of life sciences sector in Greater Montréal and throughout Québec. This new partnership will allow not only to intensify actions to stimulate the arrival of new events, it will also help to optimize the economic benefits and intellectual innovation and the development of companies and organizations active in these major sectors of the economy of the metropolis and Quebec.This one is worth watching. I think a more structured approach will succeed here and may serve as a model. They have a strong foundation of companies, a well organized association with Montreal Invivo, an enthusiastic partner with the Palais de Congres, funding, achievable objectives and passion.
  • A useful small market example – Two years ago I was asked by a client to look at several small market areas in order to find a sales model which could be replicated for a venue elsewhere. One point in common was that a major university existed in Knoxville as well as the city my client wanted evaluated. I learned through a salesperson at the Knoxville Convention Center, that several events were hosted at the convention center as a result of a business relationship which had developed between the center and the University of Tennessee. On-going research activities at the university and the influence of a prominent faculty member brought the events to Knoxville. In December 2015 this press release was published:

    Scientific conferences choose Knoxville for innovation

    December 9th, 201

    With two national scientific conferences in our facility this week, the Knoxville Convention Center welcomes industry leaders in two rapidly emerging fields – carbon fiber and energy and environmental technology. Meeting and convention planners select Knoxville for its central location and close proximity to heavy hitters in scientific innovation, such as Oak Ridge National Laboratory and the University of Tennessee.

    Carbon fiber technology and 3-D printing is the future of manufacturing technology, and East Tennessee is one the forefront of this emerging industry thanks to work by the Oak Ridge National Laboratory and private companies, such as Local Motors. Leaders and experts in the industry are at the Knoxville Convention Center this week for Composites World’s Carbon Fiber 2015.

    Exhibitors at the conference will display the latest in carbon fiber and 3-D printing technologies – including a 3-D printed car constructed at Oak Ridge National Laboratory that they pulled right onto our concourse!

    On Tuesday, the conference offered the opportunity for guests to tour the Department of Energy’s Manufacturing Development Facility at Oak Ridge National Laboratory (ORNL) and see the advances in carbon fiber technology and additive manufacturing happening right here in East Tennessee. Keynote speakers and panels throughout the conference will highlight the design and fabrication of carbon fiber structures and parts, as well as applications in wind energy, automotive, aerospace and additive manufacturing.

    ETEBA has held its annual conference at the Knoxville Convention Center since 2003 and has also has strong partnerships with ORNL. ETEBA is a non-profit trade association representing nearly 200 companies, large and small, that are mostly innovative firms in various environmental and energy-related fields, engineering and construction services.

    The conference features key note speakers from the U.S. Department of Energy, panels and workshops on growing industry of energy technology and environmental, as well as great networking opportunities.

    The Knoxville Convention Center is proud that East Tennessee is a hub of innovation in the scientific field, and we are pleased to be able to provide them with excellent service in the beauty of East Tennessee.

Recommendations

  • Conduct a rapid review of the knowledge sector in your city; who are they, where are they, why are they located here? Meet with the city economic development staff. Describe why you’re interested
  • Get to know them. Learn if there is an association representing their industry locally. If so, this is an ideal working situation.
  • Arrange introductions to each company’s leadership
  • Describe how your convention center could be an ideal meeting place for a variety of uses; private meetings, sales meetings, product roll out and demos; recruiting fairs, board meetings, shareholder meetings and social gatherings.
  • Learn what conferences, conventions and tradeshows they normally attend. See which could fit at your center. Ask for their help and influence to persuade events to play in your city.
  • Stay apprised on business strategies to attract knowledge hub related events elsewhere.

Learn More About How Statistics Can Shape Your Marketing Plans

Download our two White Papers (now offered at no charge):

In the Pursuit of National Medical/Health Science Events – A Primer Focused on Convention Centers

Booking National Religious Events – A Primer for Convention Centers on How Event Location Decisions Are Made

Visit    http://www.conventioncenternow.com/white-papers

Weighing in on the FCC WiFi Regulation and Enforcement at Convention Centers – The Problem, the Fines, the Arguments and a Rational Path Forward for Convention Centers

In 2013 and 2014 the FCC launched three investigations of business practices relating to WiFi service at convention centers. In January 2015 the FCC issued an unequivocal Enforcement Advisory prohibiting any form of intentionally blocking or disrupting personal WiFi hotspots. The FCC has also levied heavy fines on three companies, two which hold exclusive telecommunications contracts at convention centers. Now as of this writing, a possible court challenge to FCC’s enforcement actions looms. Meanwhile show managers and exhibitors who depend heavily on reliable WiFi for their event are engaged in a level of utility planning that they are not well prepared for or used to. How did things get to this point and is there a rational effective path forward for convention centers?

For wireless internet services, things took a turn about 5 years ago with the explosive growth in WiFi. The convention center controversy started to emerge when some articles appeared in two industry publications in 2012 and 2013. They were written by the founder and Sales Director of an independent WiFi provider. One of the articles was much more than an information and marketing piece, but rather a direct disparagement of convention center wireless business practices.  The fire for this controversy was really lit with the announcement by the FCC in October 2014 of a Consent Decree to settle allegations that Marriott Hotel Services Corp. interfered with and disabled WiFi networks established by consumers in Gaylord Opryland Hotel and Convention Center. The settlement included a $600,000 fine, a development of a compliance plan and an agreement for Marriott to submit usage and compliance reports.

A Brief Chronology

  • March 2013 – FCC receives a complaint from an individual attending an event at the Gaylord Opryland Convention Center in Nashville that Marriott management was “jamming” mobile hotspots so that you can’t use them in convention space. In subsequent FCC investigations Marriott admitted that one or more employees used containment features of a WiFi monitoring system to prevent consumers from connecting to the internet via a personal WiFi network.
  • June 24, 2014 – FCC receives informal complaint regarding WiFi blocking at several convention centers in Cincinnati, Columbus, Indianapolis, Orlando and Phoenix. All these centers are municipal or government authority owned and Smart City is the telecommunications contractor in each. .
  • August 25, 2014 – The American Hotel and Lodging Association (AHLA), Marriott International (managers of Gaylord Opryland) and Ryman Hospitality Properties (owners of Gaylord Opryland) submit a Petition for a Declaratory Ruling to Interpret 47 U. S. C. – Section 333. Section 333 of the Communications Act provides that “No person shall willfully or maliciously interfere with or cause interference to any radio communications of any station licensed or authorized by or under this Act or operated by the United States Government.”
  • October 3, 2014 FCC issues a Consent Decree to settle allegations that Marriott Hotel Services Corp. interfered with and disabled WiFi networks established by consumers in Gaylord Opryland Hotel and Convention Center. The settlement included a $600,000 fine, a development of a compliance plan and an agreement for Marriott to submit usage and compliance reports.
  • October 23, 2014 – FCC receives an informal complaint about WiFi blocking at the Baltimore Convention Center. The telecommunications contractor at the center is MC Dean.
  • December 2014 –Google, Microsoft, the CTIA and others issue comments supporting the FCC’s action and agreeing with FCC’s interpretation of Section 333, their right to enforce the regulations and recommending denial of the AHLA’s Petition.
  • December 2014 – Cisco issues comments to the FCC regarding the Petition for a Declaratory Ruling to Interpret 47 U. S. C. – Section 333.
  • December 30, 2014 – Marriott issues statement explaining that the matter does not involve in any way Wi-Fi access in hotel guestrooms or lobby spaces.
  • January 5, 2015 – Smart City Networks issues comments to the FCC regarding the Petition for a Declaratory Ruling to Interpret 47 U. S. C. – Section 333
  • January 27, 2015 – .The FCC issues an Enforcement Advisory regarding intentional interference of WiFi hotspots.
  • January 30,2015 The AHLA, Marriott International (managers of Gaylord Opryland) and Ryman Hospitality Properties (owners of Gaylord Opryland) formally withdraw Petition
  • August 18, 2015 FCC issues a Consent Decree to settle allegations that Smart City interfered with and disabled WiFi networks established by consumers in various convention centers where they had contracts to manage the telecommunications systems and networks. The settlement included a $750,000 fine, a development of a compliance plan and an agreement for Smart City to submit usage and compliance reports. In an FCC press release regarding this matter, the FCC characterized the presumed intent of Smart City’s “blocking “ as an effort to collect an $80 daily fee charged for using the convention center WiFi.
  • August 18, 2015 – In response to the August 18th FCC press release, Smart City issues a press release commenting thatthere was no finding by the FCC in the Consent Decreethat the Smart City’s equipment would automatically turn off devices in response to economic considerations (for instance: payment of an “$80 fee”).
  • November 2, 2015 – FCC releases a Notice of Apparent Liability for Forfeiture fining MC Dean $718,000 for maliciously blocking personal WiFi networks in the Baltimore Convention Center and for creating interference for certain WiFi networks outside the convention center. As part of this document, two FCC Commissioners make dissenting statements regarding the Notice.
  • November 2, 2015 – MC Dean issues press release stating their objections to FCC’s action and announcing their intent to challenge the FCC Notice.
  • November 10, 2015 – On Twitter, Smart City makes statement supporting MC Dean’s intention to challenge the FCC Notice.
  • November 18, 2015 – MC Dean issues a press release referencing support for the statements made by FCC Commissioner Pai in testimony before Congress. In that testimony Commissioner Pai specifically referenced MC Dean’s Notice of Liability and stated that MC Dean did not break FCC rules. Further, he characterized the fines against certain communications companies as “egregious violations of due process.” MC Dean reiterated their intention to challenge FCC’s Notice of Liability.

The Power and Momentum of Bad Publicity

It’s hard to get past sentiments expressed in the many articles, editorials and blogs written about this matter. The headlines and vivid language portended an ugly outcome. This was typical – “It’s About Damn Time: FCC Says Convention Centers Can’t Block Wifi. Another read, “A couple months ago, Marriott got busted by the FCC for blocking personal hotspots of its guests at its Gaylord Opryland resort in Nashville. It was a simple plan: break everyone’s WiFi at a tradeshow, and then charge exhibitors $1,000 a pop to access the “official” hotel WiFi”.

Convention centers were specifically mentioned in the FCC’s Enforcement Advisory. Convention centers and their telecommunications contractors have been damaged by unfavorable publicity. Some flaws and blunders in their business strategy, pricing model and a few inelegant customer service practices have been exposed. For most of the convention centers however, especially where Smart City was the contractor, the economically driven motivation for containing or blocking unauthorized WiFi signals of personal hot spots was exaggerated. Yet FCC seemed to seize on the on the “you have to pay to play” theme. It was this emotional trigger that drove the FCC’s public statements and actions.

In retrospect there’s always been tension bubbling beneath the surface. Exhibitors are naturally suspicious of service pricing by exclusive contractors – from an event’s general decorating contractor to services provided by convention centers and their exclusive concessionaires. But the strongest sentiment and I believe the catalyst for the FCC to issue their stern Enforcement Advisory were the many written statements submitted by well known companies and organizations who were asked to comment on AHLA’s Petition requesting a Declaratory Ruling to Interpret 47 U. S. C. – Section 333. Google described Marriott’s actions as engaging in “secret jamming”. One statement by the Open Technology Institute summed it best, “There is a critical distinction between inadvertent interference and the sort of knowing and anti-competitive, economically-motivated interference that Petitioners seek to make legitimate with this Petition.” The FCC review of public comments on the AHLA’s Petition and resulting Enforcement Advisory were not thorough or objective. Indeed there is a crusading element characterizing their actions. They focused on the alleged mercenary nature of the WiFi blockage or jamming which was undertaken to coerce users to pay exorbitant fees and upsetting the principled ideals of transparency and fairness. In quick succession after the commentaries were read and published, the FCC issued their Enforcement Advisory and the AHLA and Marriott formally withdrew Petition. This was followed with these public statements by FCC’s managers and Commissioners:

  • “It is unacceptable for any company to charge consumers exorbitant fees to access the Internet while at the same time blocking them from using their own personal Wi-Fi hotspots to access the Internet,” – Travis LeBlanc, Chief of the FCC’s Enforcement Bureau
  • “….last year a bunch of hotels banded together and filed a petition with the FCC. They asked the agency to bless their ability to block hotel guests from using their own Wi-Fi connections under the guise of network security concerns. . . . let’s not let this petition linger or create any uncertainty. I hope my colleagues at the FCC will work with me to dismiss this petition without delay.” – Commissioner Jessica Rosenworcel, speaking at the Commission’s “ at the State of the Net Conference
  • “The Communications Act prohibits anyone from willfully or maliciously interfering with authorized radio communications, including Wi-Fi. Marriott’s request seeking the FCC’s blessing to block guests’ use of non-Marriott networks is contrary to this basic principle.”, – FCC Chairman Tom Wheeler

At this point in time with FCC’s Enforcement Advisory already published, investigations were well underway at other convention centers. The telecommunications service providers at those convention centers were Smart City and MC Dean. The writing was on the wall for both of them – expensive fines, public embarrassment and unreasonable regulations.

The Fundamental Flaw in FCC’s Investigations and Actions

FCC’s investigations relied on a fundamentally flawed premise – exhibit halls and meeting rooms were classified as space open to the general public. Further, attendees were regarded as consumers compared to shoppers in a mall or travelers in a train station. As one reads through the narratives presented in the Consent Decrees, Enforcement Advisories, press releases, and finally the Notice of Apparent Liability you come to understand through the FCC’s descriptions, expressed and implied, that they really did not understand what a convention center is. Several of the commentaries from other corporations and organizations talk about hotel guests as the aggrieved parties. In Microsoft’s commentary they gave an example of a hotel guest subjected to blocking:

“A proprietary network operator taking actions in the name of improving its network’s reliability or performance could also leverage these actions to compete unfairly and harm consumers.For example, if a customer arrives at a hotel with her own Mi-Fi device and the hotel interferes with the customer’s connection to that personal hotspot, the hotel can effectively force the customer to purchase the hotel’s Wi-Fi services to gain access, even though the customer has already paid her mobile operator for personal hotspot capability. In effect, the Hotel Industry Interests’ proposal would allow entities to use unlicensed spectrum in a proprietary manner, e.g., as if they were operators of licensed spectrum, thereby limiting or preventing access by lawful devices to the unlicensed spectrum, which is a public resource. It is precisely that sort of radio frequency interference — whether through use of signal jammers or sending signals to de-authenticate rival access points—that Section 333 is designed to prevent.”


Microsoft tells a good story. It has a real “bully vs. innocent victim” quality to it, one that seemed to resonate with the FCC. There are other comments on the record by private citizens, all from the perspective of a hotel room guest. These comments are irrelevant however. Convention centers are not hotels and their customers are not guests in a rented hotel room. The FCC carried on however and in the Marriott Consent Decree put convention centers in the same sentence as “…..places accessible to the public, such as restaurants, coffee shops, malls, train stations, airports, convention centers and parks” (quote from FCC’s Enforcement Bureau Order – In the Matter of Marriott International Inc. and Marriott Hotel Services Inc. – October 3, 2014). The FCC sees trade show and convention exhibitors and attendees as the general public in a public space. Indeed they are not. A typical trade show advertises its event to those in the trade only. In fact many times they have the tag line as “trade only”. Exhibitors do not want to use their limited time discussing their product or service with someone who has no intention of buying it. Exhibitors are not just any company. Quite often exhibitors are juried as to whether they’ll be asked to exhibit. These shows have an order and discipline that keeps them on focus and clearly excludes the general public and exhibitors who are not part of the industry sector. Conventions and professional meetings have similar methods. The public is not invited to a medical convention or an engineering seminar. The agreement or contract between an event management company and the convention center is a License Agreement, not a property lease as in a multi tenant commercial building. Licensing agreements are fairly lengthy and complex documents. The scope of the agreement normally includes a time period, financial terms, insurance matters, exclusive rights retained by the owner including access and services (such as internet access) and restrictions and rules about the use of the space. Portions of centers such as the lobbies, entranceways and concourses are public. These areas often include art for public viewing, coffee shops, restaurants and other retail. The meeting rooms and exhibit halls are not “public” (exceptions are public consumer shows such as automobile or home improvement shows – these are not the core business of convention centers).These facts were cited in Smart City’s comments to the FCC:

“….most of the parties supporting the Petition seem to agree that devices in normal operation that do not pose a threat to security or to network reliability and are operating in a public space should not be subject to containment. These parties are urging the Commission to balance the public interest for protection against carte blanche interference with the need for reasonable network management practices that ensure safe and reliable WiFi service in non-public spaces (meeting rooms and exhibit halls) and during private events.”

Cisco also described a related situation by equating a WiFi network at a convention center with an enterprise network vs. a home WiFi network or an enterprise network the public routinely uses and business security is not such an issue. An enterprise network is a common way to classify a network with a higher level of management control where network administrators can view managed and authorized access points as well as those that are not. The administrator can determine whether an unauthorized access point is a security threat or is likely to cause a reliability problem. A decision can be made to take appropriate action. This description fits what should be the network capabilities at a convention center. In their comments to the FCC Cisco describes further:

“…..in public places or places where the public is routinely invited, users have   every reason to expect that they can make use of personal hot spot technology, unless the user’s device is presenting a security threat of some type to the co-located enterprise or service provider Wi-Fi network. That balance shifts in enterprise locations where many entities use their Wi-Fi networks to convey company confidential information, trade secrets, and for the safety and security of the firm and its employees. In these situations, enterprises must be able to assert policies on the use of wireless technologies for employees and guests in order to safeguard the network, data and devices. This is not a problem limited to critical infrastructure firms or sensitive government installations, but can extend to any enterprise. Similarly, service provider Wi-Fi networks are used by members of the public with the expectation that their data and devices will be secure, and service providers must have the flexibility to use network management technology to meet that expectation.”


Section 333 and Rule 15 – Inconsistencies, Contrary Language, Confusion and Lack of Due Process

On legal and technical matters, the FCC in their investigations of MC Dean appeared to double down on their justification of a $718,000 fine. In a long (21 pages) Notice of Apparent Liability for Forfeiture the FCC’s narratives are much more detailed and strident. I got the impression that the FCC took this opportunity to counter the arguments posed by Cisco months earlier. The Baltimore Convention Center may have been more aggressive than most in its deauthentication of unauthorized hot spots. Additionally, continuing those actions after publication of the Marriott Consent Decree was clearly impolitic. But again, the FCC relied on a premise which was fundamentally flawed as described above. If you are close to this controversy and have the patience to wade through all the semantic arguments on Rule 15 equipment or the true meaning of licensed radio stations, or if deauthentication fits the FCC’s meaning of interference, or the fair warning rule, you will find yourself agreeing at some point with the FCC and at times with the convention centers. That in itself is at least cause to consider a rulemaking review. The dissenting opinions of Commissioners O’Reilly and Pai point out the inconsistencies and confusion of the current regulations and recommend a thorough FCC review. They have made these statements in their dissent over the Notice of Apparent Liability (MC Dean) and most recently (FCC Commissioner Pai) in front of the House of Representatives Subcommittee on Communications and Technology.

Recommendations – Next Steps for Convention Centers

  1. Be Cautious About the Possible MC Dean Court Challenge with the FCC – The disagreements MC Dean has with the FCC align well with the positions of other convention centers and their contractors and the dissenting FCC Commissioners (Pai and O’Reilly). However, I believe that in court the FCC will make a convincing case that section 333 is broad enough that it can be applied to unlicensed WiFi operations. The peculiar thing about 333 and other rules is that arguments can just as easily be made in favor of the convention centers point of view. My belief therefore is that the process or forum where disagreements can be aired and discussed is as meaningful as the substance. What should be avoided is the possibility of this becoming a face saving exercise. If this happens, given the political winds, the FCC’s current Enforcement Advisory will probably prevail. I favor something akin to the AHLA’s Petition or any alternative forum where the issues can be discussed rationally and there is recognition that a convention center’s exhibit halls and meeting rooms are classified improperly by the FCC. The forum should be non confrontational, the players have to be well prepared and knowledgeable and the message has to be well crafted. I am aware that IAVM has organized a group, the WlFi Coalition, which includes convention center, telecommunications contractor (Smart City in this case) and event manager participation. I am no fan of committees but this is a good start. Hopefully the outcome of the group’s efforts will show that the convention center industry is a bona fide industry sector and their WiFi operations unique and set apart from the general public. Perhaps such a group would have standing to represent the convention center industry in discussions with the FCC.
  1. Don’t Give Up or Forfeit Wireless Services as an Exclusive Service – You’re in a serious business with serious players. To fail at this would tell the marketplace you are not. It will damage your brand. It will adversely affect event bookings and it will further erode service revenue.
  1. Demonstrate Competence in Supplying Wireless Service and Do It Consistently – You can’t really be exclusive unless you consistently demonstrate safe and reliable services. Your clients would prefer an elegant solution with a convention center designing and operating a reliable network with ample bandwidth and proper management practices to handle high density situations. They also expect security from potential problems such as a concentration of independent (unauthorized) WiFi users adversely affecting operations to be pre-emptive so problems are solved before they can happen. At this writing, CES is underway at the Las Vegas Convention Center. It will be interesting to see how things go. Cox Communications has the exclusive contract for telecommunications there, including WiFi. They have brought in several telecommunications sub-contractors to handle volume and help manage the massive network requirements for this show. If things go well and for the benefit of all convention centers, there is a wish list:
  • For the LVCC – Write a case study about the experience. This is not a request to give away technical secrets. Rather it is simply the good news which would lift the confidence of event managers who have many other things to worry about and I believe would prefer the elegant solution of a single competent telecommunications team that their exhibitors and attendees can count on.
  • Be conscious of keeping all the success stories out there through press releases and case studies. Do not sit quietly when untrue and exaggerated claims against you are made
  • For the trade show press and bloggers – Maybe you should write about it too.
  • For the independent suppliers of WiFi equipment – Rather than shoot arrows from your comfortable chair or acting as a proxy enforcer for the FCC, get some skin in the game; compete for a convention center telecommunications contract, take the risk and make the necessary capital investment, provide the day to day resources of talent, labor, administration and equipment, and sweat over ROI and profit/loss statements.
  1. Perform a Thorough Management Review of Policies, Contracts and PricingThe optimist’s guidance is usually to try and make an asset out of a liability. This controversy is a setback but also an opportunity to make things right. If and when the FCC gets around to re-considering something akin to the AHLA’s original Petition, some clean up and thoughtful review of policies and WiFi pricing will dampen the toxic emotional environment that propelled this controversy in the first place. Some obvious suggestions:
  • The negative consequences of exclusive contractors overreaching on price is nothing new. It’s an old recurring issue in the convention center business. When there are exclusive contracts based on minimum revenue guarantees and profit sharing, contractors can easily morph into accountants and bankers rather than service providers. Convention center managers have to be assertive and review pricing structures periodically. Most exclusive service contracts give centers the discretion to change prices. Pay attention to market trends, concepts of fair price can change rapidly.
  • Convention center management has to be directly involved all the time when exclusivity disagreements arise. As operators we have all experienced this. In my time at Javits we would periodically run into a disagreement on the exclusivity of food & beverage service, on corporate sponsorships and electric service. These matters can be handled and settled with finesse and good solid judgment. When they are settled in a heavy handed fashion, the controversy ferments and the results are usually ugly.
  • If you have a contract with a telecommunications firm don’t be constrained from taking action because of contract terms. Think about whether the contract needs to be amended in light of the current circumstances. There has to be a means of keeping pace with the rapid wireless communications changes and the business habits event attendees while keeping the business terms of fair commissions for the convention center and fair rate of return for the contractor.
  1. Think Very Seriously About Offering Free WiFi for the Entire Convention Center – Many of the convention centers already have implemented this in the public spaces. Only two that I know of offer WiFi throughout the center. The Boston Convention and Exhibition Center and the San Jose Convention Center offer it throughout with no conditions. Reports from Boston show that WiFi use has doubled since free WiFi was rolled out.Reckoning with free WiFi is a tough call for many but is the best course of action. There is an author Chris Anderson who wrote a book entitled “Free: The Future of Radical Price”. He has a clever way of addressing this issue:
  • If it’s digital, sooner or later it’s going to be free. In competitive markets price falls to marginal cost. The internet is the world’s most competitive market and the marginal costs of technologies it runs on –bandwidth, processing and storage – will become less each year. Free will become not just an option but an inevitability.
  • You can’t stop free. In the digital realm you can try and keep free away with laws and locks, but eventually the force of economic gravity will win. What that means is the only thing stopping your product from being free is a secret code or scary warning, you can be sure that there’s someone out there who will defeat it. Take free back from the pirates, and sell upgrades.
  • Sooner or later you will compete with free.
  • You can make money from free. People will pay for convenience, to save time, for status, for the things they love. Free opens doors, reaching new consumers.

If implemented, convention centers and their contractors will have an expense when previously there was reliable revenue. Also, free WiFi doesn’t mean diminished service and slow reaction to problems. In fact, I would expect service expectations to intensify.

Monetizing free WiFi may not be as foreign or daunting as you think. For convention centers and their contractors, there’s a few obvious ways to exploit free WiFi for revenue opportunities; classify free as basic service and up-sell premium on the WiFi guest portal; sell advertising through ads or a downloadable mobile app for local restaurants and entertainment; sell stuff; sell push notifications; run a concierge service. In fact there are many ways to exploit free and there are countless examples from other companies’ experience about what works and what doesn’t.